Applying styles and colors
Summary
This part of the canvas tutorial explains how to color and style canvas shapes. It provides examples for simple coloring and line styles but also for more complex styles likes gradients.
In the chapter about drawing shapes only the default line and fill styles were used. In this chapter we will explore all the canvas options we have at our disposal to make our drawings a little more attractive.
Colors
Up until now we’ve only seen methods of the drawing context. If we want to apply colors to a shape, there are two important properties we can use: fillStyle and strokeStyle.
strokeStyle is used for setting the shape outline color and fillStyle is for the fill color. These properties can be set to a string representing a CSS color value, a gradient object, or a pattern object. By default, the stroke and fill color are set to black (CSS color value #000000).
If you set the strokeStyle and/or fillStyle property, the new value becomes the default for all properties being drawn from then on. For every object you want in a different color, you will need to reassign the fillStyle or strokeStyle property with the new color value before that object is rendered.
The valid strings these color properties accept are expressed by CSS3 color values. Each of the following examples describe the same color.
// these all set the fillStyle to 'orange'
ctx.fillStyle = "orange";
ctx.fillStyle = "#FFA500";
ctx.fillStyle = "rgb(255, 165, 0)";
ctx.fillStyle = "rgba(255, 165, 0, 1)";
Note: Currently not all CSS 3 color values are supported in the Gecko engine. For instance the color values hsl(100%,25%,0) or rgb(0,100%,0) are not allowed. If you stick to the ones above, you won’t run into any problems.
A fillStyle example
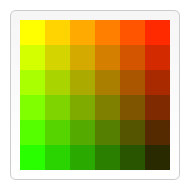
In this example, two for loops are used to draw a grid of rectangles, each in a different color. The iterators i and j modify the red and green values of the rgb() function creating a dynamic palette. By decreasing the step values and increasing the number of rectangles rendered smoother transitions between colors can be achieved.
function draw() {
  var stepValue = 42.5;
  var numRows = 6;
  var numCols = 6;

  var ctx = document.getElementById('canvas').getContext('2d');

  for (var i=0; i<numRows; i++){
    for (var j=0; j<numCols; j++){

      //set the fill style for each rectangle drawn
      //the rgb() function only takes integers
      //use Math.floor to return whole numbers
      ctx.fillStyle = 'rgb(' + Math.floor(255 - (stepValue*i)) + ','
                              + Math.floor(255 - (stepValue*j)) + ',0)';
      ctx.fillRect( j*25, i*25, 25, 25);
    }
  }
}
A strokeStyle example
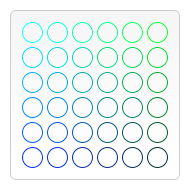
This example is similar to the one above but now using the strokeStyle property. Here the arc method is used to draw circles instead of squares.
  function draw() {
    var ctx = document.getElementById('canvas').getContext('2d');
    for (var i=0; i<6; i++){
      for (var j=0; j<6; j++){
        ctx.strokeStyle = 'rgb(0,' + Math.floor(255-42.5*i) + ',' +
                         Math.floor(255-42.5*j) + ')';
        ctx.beginPath();
        ctx.arc(12.5+j*25, 12.5+i*25, 10, 0, Math.PI*2, true);
        ctx.stroke();
      }
    }
  }
Transparency
Semi-transparent shapes can also be drawn to the canvas. This can be accomplished in one of two ways, by setting the globalAlpha property, or assigning an alpha value to the stroke/fill style.
syntax:: context.globalAlpha = transparency value;
This property applies a transparency value to all shapes drawn on the canvas. The valid range of values is from 0.0 (fully transparent) to 1.0 (fully opaque). By default, this property is set to 1.0 (fully opaque).
If you would like to assign transparency on a per shape basis, you can use the strokeStyle and fillStyle properties mentioned above. Using the CSS3 rgba() function, the following notation assigns transparent color.
// Assigning transparent colors to stroke and fill style
ctx.strokeStyle = "rgba(255, 0, 0, 0.5)";
ctx.fillStyle = "rgba(255, 0, 0, 0.5)";
The rgba() function is similar to the rgb() function but it has one extra parameter. The last parameter sets the alpha value of color defined by the r, g, and b parameters. The valid range is between 0.0 (fully transparent) and 1.0 (fully opaque).
A globalAlpha example
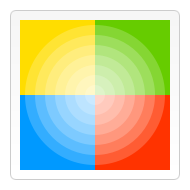
In this example, a set of semi-transparent concentric circles are drawn on top of four opaque squares. By setting the globalAlpha property before the for loop, the circles inherit the transparency value while the background does not. Overlaying the decreasing circles forms a radial gradient as their opacity is additive.
function draw() {
  var ctx = document.getElementById('canvas').getContext('2d');
  // draw background
  ctx.fillStyle = 'yellow';
  ctx.fillRect(0,0,75,75);
  ctx.fillStyle = 'green';
  ctx.fillRect(75,0,75,75);
  ctx.fillStyle = 'red';
  ctx.fillRect(0,75,75,75);
  ctx.fillStyle = 'blue';
  ctx.fillRect(75,75,75,75);
  ctx.fillStyle = 'white';

  // set transparency value
  ctx.globalAlpha = 0.2;

  // Draw semi transparent circles
  for (var i=0; i<7; i++){
      ctx.beginPath();
      ctx.arc(75, 75,10+10*i,0, Math.PI*2, true);
      ctx.fill();
  }
}
An example using rgba()
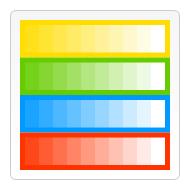
Here, instead of drawing circles on top of each other, small rectangles are drawn with increasing opacity. Using rgba() gives you a little more control and flexibility because the fill and stroke styles can be set individually.
function draw() {
  var ctx = document.getElementById('canvas').getContext('2d');

  // Draw background
  ctx.fillStyle = 'rgb(255,221,0)';
  ctx.fillRect(0,0,150,37.5);
  ctx.fillStyle = 'rgb(102,204,0)';
  ctx.fillRect(0,37.5,150,37.5);
  ctx.fillStyle = 'rgb(0,153,255)';
  ctx.fillRect(0,75,150,37.5);
  ctx.fillStyle = 'rgb(255,51,0)';
  ctx.fillRect(0,112.5,150,37.5);

  // Draw semi transparent rectangles
  for (var i=0;i<10;i++){
    ctx.fillStyle = 'rgba(255,255,255,'+(i+1)/10+')';
    for (var j=0;j<4;j++){
      ctx.fillRect(5+i*14,5+j*37.5,14,27.5)
    }
  }
}
Line styles
There are several properties which allow us to style lines.
lineWidth = value
lineCap = type
lineJoin = type
miterLimit = value
I could describe these in detail, but it will probably be made clearer by just looking at the examples below.
A lineWidth example
This property sets the current line thickness. Values must be positive numbers. By default this value is set to 1.0 units.
The line width is the thickness of the stroke centered on the given path. In other words, the area that’s drawn extends to half the line width on either side of the path. Because canvas coordinates do not directly reference pixels, special care must be taken to obtain crisp horizontal and vertical lines.
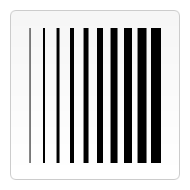
In the example below, 10 straight lines are drawn with increasing line widths. The line on the far left is 1.0 units wide. However, the leftmost and all other odd-integer-width thickness lines do not appear crisp, because of the path’s positioning.
function draw() {
  var ctx = document.getElementById('canvas').getContext('2d');
  for (var i = 0; i < 10; i++){
    ctx.lineWidth = 1+i;
    ctx.beginPath();
    ctx.moveTo(5+i*14,5);
    ctx.lineTo(5+i*14,140);
    ctx.stroke();
  }
}
Obtaining crisp lines requires understanding how paths are stroked. In the images below, the grid represents the canvas coordinate grid. The squares between grid lines are actual on-screen pixels. In the first grid image below, a rectangle from (2,1) to (5,5) is filled. The entire area between them (light red) falls on pixel boundaries, so the resulting filled rectangle will have crisp edges.
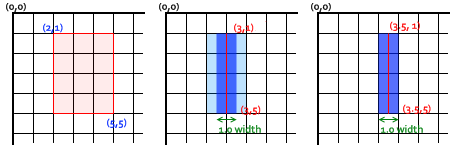
If you consider a path from (3,1) to (3,5) with a line thickness of 1.0, you end up with the situation in the second image. The actual area to be filled (dark blue) only extends halfway into the pixels on either side of the path. An approximation of this has to be rendered, which means that those pixels being only partially shaded, and results in the entire area (the light blue and dark blue) being filled in with a color only half as dark as the actual stroke color. This is what happens with the 1.0 width line in the previous example code.
To fix this, you have to be very precise in your path creation. Knowing that a 1.0 width line will extend half a unit to either side of the path, creating the path from (3.5,1) to (3.5,5) results in the situation in the third image — the 1.0 line width ends up completely and precisely filling a single pixel vertical line.
Note: Be aware that in our vertical line example, the Y position still referenced an integer grid line position — if it hadn’t, we would see pixels with half coverage at the endpoints (but note also that this behavior depends on the current lineCap style whose default value is butt; you may want to compute consistent strokes with half-pixel coordinates for odd-width lines, by setting the lineCap style to square, so that the outer border of the stroke around the endpoint will be automatically extended to cover the whole pixel exactly).
Note also that only start and final endpoints of a path are affected: if a path is closed with closePath(), there’s no start and final endpoint; instead, all endpoints in the path are connected to their attached previous and next segment using the current setting of the lineJoin style, whose default value is miter, with the effect of automatically extending the outer borders of the connected segments to their intersection point, so that the rendered stroke will exactly cover full pixels centered at each endpoint if those connected segments are horizontal and/or vertical). See the next two sections for demonstrations of these additional line styles.
For even-width lines, each half ends up being an integer amount of pixels, so you want a path that is between pixels (that is, (3,1) to (3,5)), instead of down the middle of pixels.
While slightly painful when initially working with scalable 2D graphics, paying attention to the pixel grid and the position of paths ensures that your drawings will look correct regardless of scaling or any other transformations involved. A 1.0-width vertical line drawn at the correct position will become a crisp 2-pixel line when scaled up by 2, and will appear at the correct position.
A lineCap example
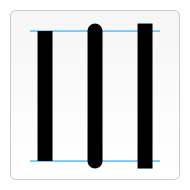
The lineCap property determines how the end points of every line are drawn. There are three possible values for this property and those are: butt, round and square. By default this property is set to butt.
In this example, I’ve drawn three lines, each with a different value for the lineCap property. I also added two guides to see the exact differences between the three. Each of these lines starts and ends exactly on these guides.
The line on the left uses the default butt option. You’ll notice that it’s drawn completely flush with the guides. The second is set to use the round option. This adds a semicircle to the end that has a radius half the width of the line. The line on the right uses the square option. This adds a box with an equal width and half the height of the line thickness.
function draw() {
  var ctx = document.getElementById('canvas').getContext('2d');
  var lineCap = ['butt','round','square'];

  // Draw guides
  ctx.strokeStyle = '#09f';
  ctx.beginPath();
  ctx.moveTo(10,10);
  ctx.lineTo(140,10);
  ctx.moveTo(10,140);
  ctx.lineTo(140,140);
  ctx.stroke();

  // Draw lines
  ctx.strokeStyle = 'black';
  for (var i=0;i<lineCap.length;i++){
    ctx.lineWidth = 15;
    ctx.lineCap = lineCap[i];
    ctx.beginPath();
    ctx.moveTo(25+i*50,10);
    ctx.lineTo(25+i*50,140);
    ctx.stroke();
  }
}
A lineJoin example
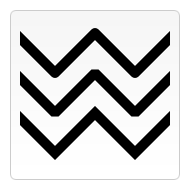
The lineJoin property determines how two connecting segments (of lines, arcs or curves) with non-zero lengths in a shape are joined together (degenerate segments with zero lengths, whose specified endpoints and control points are exactly at the same position, are skipped).
There are three possible values for this property: round, bevel and miter. By default this property is set to miter. Note that the lineJoin setting has no effect if the two connected segments have the same direction, because no joining area will be added in this case.
Again I’ve drawn three different paths, each with a different lineJoin property setting:
- The top path uses the
roundoption. This setting rounds off the corners of a shape by filling an additional sector of disc centered at the common endpoint of connected segments. The radius for these rounded corners is equal to the line width. - The path at the middle uses the
beveloption. This setting fills an additional triangular area between the common endpoint of connected segments, and the separate outside rectangular corners of each segment. - The path at the bottom uses the
miteroption. With this setting, connected segments are joined by extending their outside edges to connect at a single point, with the effect of filling an additional lozenge-shaped area. This setting is effected by themiterLimitproperty which is explained below.
function draw() {
  var ctx = document.getElementById('canvas').getContext('2d');
  var lineJoin = ['round','bevel','miter'];
  ctx.lineWidth = 10;
  for (var i=0;i<lineJoin.length;i++){
    ctx.lineJoin = lineJoin[i];
    ctx.beginPath();
    ctx.moveTo(-5,5+i*40);
    ctx.lineTo(35,45+i*40);
    ctx.lineTo(75,5+i*40);
    ctx.lineTo(115,45+i*40);
    ctx.lineTo(155,5+i*40);
    ctx.stroke();
  }
}
A demo of the miterLimit property
As you’ve seen in the previous example, when joining two lines with the miter option, the outside edges of the two joining lines are extended up to the point where they meet. For lines which are at large angles with each other, this point is not far from the inside connection point. However, when the angles between each line decreases, the distance (miter length) between these points increases exponentially.
The miterLimit property determines how far the outside connection point can be placed from the inside connection point. If two lines exceed this value, a bevel join will be drawn. Note that the maximum miter length is the product of the line width measured in the current coordinate system, by the value of this miterLimit property (whose default value is 10.0 in the HTML canvas), so the miterLimit can be set independantly from the current display scale or any affine transforms of paths: it only influences the effectively rendered shape of line edges.
More exactly, the miter limit is the maximum allowed ratio of the extension length (in the HTML canvas, it is measured between the outside corner of the joined edges of the line and the common endpoint of connecting segments specified in the path) to half the line width. It can equivalently be defined as the maximum allowed ratio of the distance between the inside and outside points of junction of edges, to the total line width. It is then equal to the constant of half the minimum inner angle of connecting segments below which no miter join will be rendered, but only a bevel join:
miterLimit= maxmiterLength/lineWidth= 1 / sin ( min θ / 2 )- The default miter limit of 10.0 will strip all miters for sharp angles below about 11 degrees.
- A miter limit equal to √2 ≈ 1.4142136 (rounded up) will strip miters for all acute angles, keeping miter joins only for obtuse or right angles.
- A miter limit equal to 1.0 is valid but will disable all miters.
- Values below 1.0 are invalid for the miter limit.
I’ve made a little demo in which you can set miterLimit dynamically and see how this effects the shapes on the canvas. The blue lines show where the start and endpoints for each of the lines in the zig-zag pattern are.
If you specify a miterLimit value below 4.2 in this demo, none of the visible corners will join with a miter extension, but only with a small bevel near the blue lines; with a miterLimit above 10, most corners in this demo should join with a miter far away from the blue lines, and whose height is decreasing between corners from left to right because they connect with growing angles; with intermediate values, the corners on the left side will only join with a bevel near the blue lines, and the corners on the right side with a miter extension (also with a decreasing height).
Note: Working sample from original page missing here
function draw() {
  var ctx = document.getElementById('canvas').getContext('2d');
  // Clear canvas
  ctx.clearRect(0, 0, 150, 150);
  // Draw the blue horizontal guides at y positions 50 and 100
  ctx.strokeStyle = '#0099ff';
  ctx.lineWidth   = 2;
  ctx.strokeRect(-5, 50, 160, 50);
  // check the miterLimit input and set it in canvas
  if (document.getElementById('miterLimit').value.match(/\d+(\.\d+)?/)) {
    ctx.miterLimit = parseFloat(document.getElementById('miterLimit').value);
  } else {
    alert('Value must be a positive number');
  }
  // Draw the black zig-zag thick lines, with endpoints exactly on the blue guides
  ctx.strokeStyle = '#000';
  ctx.lineWidth   = 10;
  ctx.beginPath();
  ctx.moveTo(0, 100);
  for (var i = 0; i < 24; i++) {
    var dy = (i % 2 == 0) ? 25 : -25 ;
    ctx.lineTo(Math.pow(i, 1.5) * 2, 75 + dy);
  }
  ctx.stroke();
}
Gradients
Just like any normal drawing program, we can fill and stroke shapes using linear and radial gradients. We create a canvasGradient object by using one of the following methods. We use this object to assign it to the fillStyle or strokeStyle properties.
createLinearGradient(x1,y1,x2,y2)
createRadialGradient(x1,y1,r1,x2,y2,r2)
The createLinearGradient method takes four arguments representing the starting point (x1,y1) and end point (x2,y2) of the gradient.
The createRadialGradient method takes six arguments. The first three arguments define a circle with coordinates (x1,y1) and radius r1 and the second a circle with coordinates (x2,y2) and radius r2.
var lineargradient = ctx.createLinearGradient(0,0,150,150);
var radialgradient = ctx.createRadialGradient(75,75,0,75,75,100);
Once we’ve created a canvasGradient object we can assign colors to it by using the addColorStop method.
addColorStop(position, color)
This method takes two arguments. The position must be a number between 0.0 and 1.0 and defines the relative position of the color in the gradient. Setting this to 0.5 for instance would place the color precisely in the middle of the gradient. The color argument must be a string representing a CSS color (ie #FFF, rgba(0,0,0,1),etc).
You can add as many color stops to a gradient as you need. Below is a very simple linear gradient from white to black.
var lineargradient = ctx.createLinearGradient(0,0,150,150);
lineargradient.addColorStop(0,'white');
lineargradient.addColorStop(1,'black');
A createLinearGradient example
In this example, I’ve created two different gradients. In the first, I create the background gradient. As you can see, I’ve assigned two colors at the same position. You do this to make very sharp color transitions - in this case from white to green. Normally, it doesn’t matter in what order you define the color stops, but in this special case, it does significantly. If you keep the assignments in the order you want them to appear, this won’t be a problem.
In the second gradient, I didn’t assign the starting color (at position 0.0) since it wasn’t strictly necessary. Assigning the black color at position 0.5 automatically makes the gradient, from the start to this stop, black.
As you can see here, both the strokeStyle and fillStyle properties can accept a canvasGradient object as valid input.
function draw() {
  var ctx = document.getElementById('canvas').getContext('2d');

  // Create gradients
  var lingrad = ctx.createLinearGradient(0,0,0,150);
  lingrad.addColorStop(0, '#00ABEB');
  lingrad.addColorStop(0.5, '#FFFFFF');
  lingrad.addColorStop(0.5, '#26C000');
  lingrad.addColorStop(1, '#fff');

  var lingrad2 = ctx.createLinearGradient(0,50,0,95);
  lingrad2.addColorStop(0.5, '#000');
  lingrad2.addColorStop(1, 'rgba(0,0,0,0)');

  // assign gradients to fill and stroke styles
  ctx.fillStyle = lingrad;
  ctx.strokeStyle = lingrad2;

  // draw shapes
  ctx.fillRect(10,10,130,130);
  ctx.strokeRect(50,50,50,50);

}
A createRadialGradient example
In this example, I’ve defined four different radial gradients. Because we have control over the start and closing points of the gradient, we can achieve more complex effects than we would normally have in the ‘classic’ radial gradients we see in, for instance, Photoshop. (i.e. a gradient with a single center point where the gradient expands outward in a circular shape.)
In this case, I’ve offset the starting point slightly from the end point to achieve a spherical 3D effect. It’s best to try to avoid letting the inside and outside circles overlap because this results in strange effects which are hard to predict.
The last color stop in each of the four gradients uses a fully transparent color. If you want to have a nice transition from this to the previous color stop, both colors should be equal. This isn’t very obvious from the code because I’ve used two different CSS color methods, but in the first gradient #019F62 = rgba(1,159,98,1)
function draw() {
  var ctx = document.getElementById('canvas').getContext('2d');

  // Create gradients
  var radgrad = ctx.createRadialGradient(45,45,10,52,50,30);
  radgrad.addColorStop(0, '#A7D30C');
  radgrad.addColorStop(0.9, '#019F62');
  radgrad.addColorStop(1, 'rgba(1,159,98,0)');

  var radgrad2 = ctx.createRadialGradient(105,105,20,112,120,50);
  radgrad2.addColorStop(0, '#FF5F98');
  radgrad2.addColorStop(0.75, '#FF0188');
  radgrad2.addColorStop(1, 'rgba(255,1,136,0)');

  var radgrad3 = ctx.createRadialGradient(95,15,15,102,20,40);
  radgrad3.addColorStop(0, '#00C9FF');
  radgrad3.addColorStop(0.8, '#00B5E2');
  radgrad3.addColorStop(1, 'rgba(0,201,255,0)');

  var radgrad4 = ctx.createRadialGradient(0,150,50,0,140,90);
  radgrad4.addColorStop(0, '#F4F201');
  radgrad4.addColorStop(0.8, '#E4C700');
  radgrad4.addColorStop(1, 'rgba(228,199,0,0)');

  // draw shapes
  ctx.fillStyle = radgrad4;
  ctx.fillRect(0,0,150,150);
  ctx.fillStyle = radgrad3;
  ctx.fillRect(0,0,150,150);
  ctx.fillStyle = radgrad2;
  ctx.fillRect(0,0,150,150);
  ctx.fillStyle = radgrad;
  ctx.fillRect(0,0,150,150);
}
Patterns
In one of the examples on the previous page, I used a series of loops to create a pattern of images. There is, however, a much simpler method: the createPattern method.
createPattern(image,type)
This method takes two arguments. Image is either a reference to an Image object or a different canvas element. Type must be a string containing one of the following values: repeat, repeat-x, repeat-y and no-repeat.
Note: Using a canvas element as the Image argument does not work in Firefox 1.5 (Gecko 1.8). Also, specifying a zero-sized canvas throws a NS_ERROR_DOM_INVALID_STATE_ERR exception starting in Gecko 10.0 (Firefox 10.0 / Thunderbird 10.0 / SeaMonkey 2.7).
We use this method to create a Pattern object which is very similar to the gradient methods we’ve seen above. Once we’ve created a pattern, we can assign it to the fillStyle or strokeStyle properties.
var img = new Image();
img.src = 'someimage.png';
var ptrn = ctx.createPattern(img,'repeat');
Note: Unlike the drawImage() method, you must make sure the image you use is loaded before calling this method or the pattern may be drawn incorrectly.
Note: Firefox currently only supports the repeat property. If you assign anything else, you won’t see any changes.
A createPattern example
In this last example, I created a pattern which I assigned to the fillStyle property. The only thing worth noting is the use of the Image object onload handler. This is to make sure the image is loaded before it is assigned to the pattern.
function draw() {
  var ctx = document.getElementById('canvas').getContext('2d');

  // create new image object to use as pattern
  var img = new Image();
  img.src = 'images/wallpaper.png';
  img.onload = function(){

    // create pattern
    var ptrn = ctx.createPattern(img,'repeat');
    ctx.fillStyle = ptrn;
    ctx.fillRect(0,0,150,150);

  }
}
Shadows
Using shadows involves just four properties:
shadowOffsetX = float
shadowOffsetY = float
shadowBlur = float
shadowColor = color
shadowOffsetX and shadowOffsetY indicate how far the shadow should extend from the object in the X and Y directions; these values aren’t affected by the current transformation matrix. Use negative values to cause the shadow to extend up or to the left, and positive values to cause the shadow to extend down or to the right. These are both 0 by default.
shadowBlur indicates the size of the blurring effect; this value doesn’t correspond to a number of pixels and is not affected by the current transformation matrix. The default value is 0.
shadowColor is a standard CSS color value indicating the color of the shadow effect; by default, it is fully-transparent black.
Note: Starting in Gecko 7.0 (Firefox 7.0 / Thunderbird 7.0 / SeaMonkey 2.4), shadows are only drawn for source-over compositing operations. This is per proposed changes to the specification.
A shadowed text example
This example draws a text string with a shadowing effect.
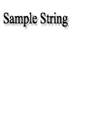
function draw() {
  var ctx = document.getElementById('canvas').getContext('2d');

  ctx.shadowOffsetX = 2;
  ctx.shadowOffsetY = 2;
  ctx.shadowBlur = 2;
  ctx.shadowColor = "rgba(0, 0, 0, 0.5)";

  ctx.font = "20px Times New Roman";
  ctx.fillStyle = "Black";
  ctx.fillText("Sample String", 5, 30);
}
Attributions
This article contains content originally from external sources, including ones licensed under the CC-BY-SA license.

Portions of this content copyright 2012 Mozilla Contributors. This article contains work licensed under the Creative Commons Attribution-Sharealike License v2.5 or later. The original work is available at Mozilla Developer Network: Article