Drawing shapes
Summary
This part of the tutorial explains how to draw lines and shapes. The article covers more complex paths, too.
The grid
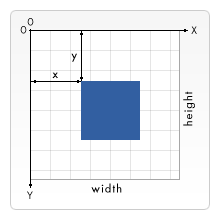
Before we can start drawing, we need to talk about the canvas grid or coordinate space. The HTML template on the previous page had a canvas element 150 pixels wide and 150 pixels high. I’ve drawn this image with the default grid overlayed. Normally 1 unit in the grid corresponds to 1 pixel on the canvas. The origin of this grid is positioned in the top left corner (coordinate (0,0)). All elements are placed relative to this origin. So the position of the top left corner of the blue square becomes x pixels from the left and y pixels from the top (coordinate (x,y)). Later in this tutorial we’ll see how we can translate the origin to a different position, rotate the grid and even scale it. For now we’ll stick to the default.
Drawing shapes
Unlike SVG, canvas only supports one primitive shape - rectangles. All other shapes must be created by combining one or more paths. Luckily, we have a collection of path drawing functions which make it possible to compose very complex shapes.
Rectangles
First let’s look at the rectangle. There are three functions that draw rectangles on the canvas:
fillRect(x,y,width,height) : Draws a filled rectangle
strokeRect(x,y,width,height) : Draws a rectangular outline
clearRect(x,y,width,height) : Clears the specified area and makes it fully transparent
Each of these three functions takes the same parameters. x and y specify the position on the canvas (relative to the origin) of the top-left corner of the rectangle. width and height are pretty obvious. Let’s see these functions in action.
Below is the draw() function from the previous page, but now I’ve added the three functions above.
Rectangular shape example
function draw(){
  var canvas = document.getElementById('tutorial');
  if (canvas.getContext){
    var ctx = canvas.getContext('2d');

    ctx.fillRect(25,25,100,100);
    ctx.clearRect(45,45,60,60);
    ctx.strokeRect(50,50,50,50);
  }
}
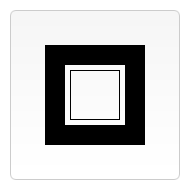
The result should look something like the image on the right. The fillRect function draws a large black square 100x100 pixels. The clearRect function removes a 60x60 pixels square from the center and finally the strokeRect draws a rectangular outline 50x50 pixels inside the cleared square. In the following pages we’ll see two alternative methods for the clearRect function and we’ll also see how to change the color and stroke style of the rendered shapes.
Unlike the path functions we’ll see in the next section, all three rectangle functions draw immediately to the canvas.
Drawing paths
To make shapes using paths, we need a couple of extra steps.
beginPath()closePath()stroke()fill()
The first step to create a path is calling the beginPath method. Internally, paths are stored as a list of sub-paths (lines, arcs, etc) which together form a shape. Every time this method is called, the list is reset and we can start drawing new shapes.
Note: When the current path is empty, such as immediately after calling beginPath(), or on a newly created canvas, the first path construction command is always treated as a moveTo(), regardless of what it actually is. For that reason, you will almost always want to specifically set your starting position after resetting a path.
The second step is calling the methods that actually specify the paths to be drawn. We’ll see these shortly.
The third, and an optional step, would be to call the closePath method. This method tries to close the shape by drawing a straight line from the current point to the start. If the shape has already been closed or there’s only one point in the list, this function does nothing.
The final step will be calling the stroke and/or fill methods. Calling one of these will actually draw the shape to the canvas. stroke is used to draw an outlined shape, while fill is used to paint a solid shape.
Note: When calling the fill method, any open shapes will be closed automatically and it isn’t necessary to use the closePath method.
For example, the code for drawing a triangle would look something like this:
ctx.beginPath();
ctx.moveTo(75,50);
ctx.lineTo(100,75);
ctx.lineTo(100,25);
ctx.fill();
moveTo
One very useful function, which doesn’t actually draw anything, but is part of the path list described above, is the moveTo function. You can probably best think of this as lifting a pen or pencil from one spot on a piece of paper and placing it on the next.
moveTo(x, y)
The moveTo function takes two arguments, x and y,which are the coordinates of the new starting point.
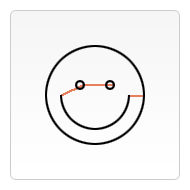
When the canvas is initialized or the beginPath method is called, you typically will want to use the moveTo method to place the starting point somewhere else. We could also use the moveTo method to draw unconnected paths. Take a look at the smiley face on the right. I’ve marked the places where I used the moveTo method (the red lines).
To try this for yourself, you can use the code snippet below. Just paste it into the draw function we saw earlier.
moveTo example
ctx.beginPath();
ctx.arc(75,75,50,0,Math.PI*2,true); // Outer circle
ctx.moveTo(110,75);
ctx.arc(75,75,35,0,Math.PI,false);   // Mouth (clockwise)
ctx.moveTo(65,65);
ctx.arc(60,65,5,0,Math.PI*2,true);  // Left eye
ctx.moveTo(95,65);
ctx.arc(90,65,5,0,Math.PI*2,true);  // Right eye
ctx.stroke();
Note: Remove the moveTo methods to see the connecting lines. For a description of the arc function and its parameters look below.
Lines
For drawing straight lines we use the lineTo method.
lineTo(x, y)
This method takes two arguments - x and y, - which are the coordinates of the line’s end point. The starting point is dependent on previous drawn paths, where the end point of the previous path is the starting point for the following, etc. The starting point can also be changed by using the moveTo method.
lineTo example
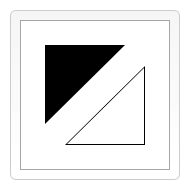
In the example below two triangles are drawn, one filled and one outlined. (The result can be seen in the image on the right). First the beginPath method is called to begin a new shape path. We then use the moveTo method to move the starting point to the desired position. Below this two lines are drawn which make up two sides of the triangle.
You’ll notice the difference between the filled and stroked triangle. This is, as mentioned above, because shapes are automatically closed when a path is filled, but not when they are stroked. If we would have left out the closePath() for the stroked triangle, only two lines would have been drawn, not a complete triangle.
// Filled triangle
ctx.beginPath();
ctx.moveTo(25,25);
ctx.lineTo(105,25);
ctx.lineTo(25,105);
ctx.fill();

// Stroked triangle
ctx.beginPath();
ctx.moveTo(125,125);
ctx.lineTo(125,45);
ctx.lineTo(45,125);
ctx.closePath();
ctx.stroke();
Arcs
For drawing arcs or circles we use the arc method. The specification also describes the arcTo method, which is supported by Safari and Firefox, but wasn’t implemented in the older Gecko browsers.
arc(x, y, radius, startAngle, endAngle, anticlockwise)
This method takes five parameters: x and y are the coordinates of the circle’s center. Radius is self explanatory. The startAngle and endAngle parameters define the start and end points of the arc in radians. The starting and closing angle are measured from the x axis. The anticlockwise parameter is a Boolean value which when true draws the arc anticlockwise, otherwise in a clockwise direction.
Note: Angles in the arc function are measured in radians, not degrees. To convert degrees to radians you can use the following JavaScript expression: var radians = (Math.PI/180)*degrees.
arc example
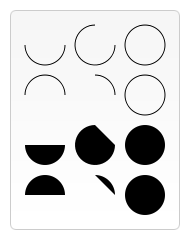
The following example is a little more complex than the ones we’ve seen above. I’ve drawn 12 different arcs all with different angles and fills. If I would have written this example just like the smiley face above, firstly this would have become a very long list of statements and secondly, when drawing arcs, I would need to know every single starting point. For arcs of 90, 180 and 270 degrees, like the ones I used here, this wouldn’t be to much of a problem, but for more complex ones this becomes way too difficult.
The two for loops are for looping through the rows and columns of arcs. For every arc I start a new path using beginPath. Below this I’ve written out all the parameters as variables, so it’s easier to read what’s going on. Normally this would be just one statement. The x and y coordinates should be clear enough. radius and startAngle are fixed. The endAngle starts of as 180 degrees (first column) and is increased with steps of 90 degrees to form a complete circle (last column). The statement for the clockwise parameter results in the first and third row being drawn as clockwise arcs and the second and fourth row as counterclockwise arcs. Finally, the if statement makes the top half stroked arcs and the bottom half filled arcs.
for(var i=0;i<4;i++){
  for(var j=0;j<3;j++){
    ctx.beginPath();
    var x              = 25+j*50;               // x coordinate
    var y              = 25+i*50;               // y coordinate
    var radius         = 20;                    // Arc radius
    var startAngle     = 0;                     // Starting point on circle
    var endAngle       = Math.PI+(Math.PI*j)/2; // End point on circle
    var anticlockwise  = i%2==0 ? false : true; // clockwise or anticlockwise

    ctx.arc(x,y,radius,startAngle,endAngle, anticlockwise);

    if (i>1){
      ctx.fill();
    } else {
      ctx.stroke();
    }
  }
}
Bezier and quadratic curves
The next type of paths available are Bézier curves, available in the cubic and quadratic varieties. These are generally used to draw complex organic shapes.
quadraticCurveTo(cp1x, cp1y, x, y) // BROKEN in Firefox 1.5 (see work around below)
bezierCurveTo(cp1x, cp1y, cp2x, cp2y, x, y)
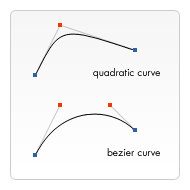
The difference between these can best be described using the image on the right. A quadratic Bézier curve has a start and an end point (blue dots) and just one control point (red dot) while a cubic Bézier curve uses two control points.
The x and y parameters in both these methods are the coordinates of the end point. cp1x and cp1y are the coordinates of the first control point, and cp2x and cp2y are the coordinates of the second control point.
Using quadratic and cubic Bézier curves can be quite challenging, because unlike vector drawing software like Adobe Illustrator, we don’t have direct visual feedback as to what we’re doing. This makes it pretty hard to draw complex shapes. In the following example, we’ll be drawing some simple organic shapes, but if you have the time and, most of all, the patience, much more complex shapes can be created.
There’s nothing very difficult in these examples. In both cases we see a succession of curves being drawn which finally result in a complete shape.
quadraticCurveTo example

// Quadratric curves example
ctx.beginPath();
ctx.moveTo(75,25);
ctx.quadraticCurveTo(25,25,25,62.5);
ctx.quadraticCurveTo(25,100,50,100);
ctx.quadraticCurveTo(50,120,30,125);
ctx.quadraticCurveTo(60,120,65,100);
ctx.quadraticCurveTo(125,100,125,62.5);
ctx.quadraticCurveTo(125,25,75,25);
ctx.stroke();
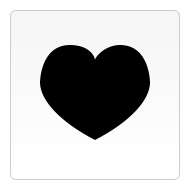
It is possible to convert any quadratic Bézier curve to a cubic Bézier curve by correctly computing both cubic Bézier control points from the single quadratic Bézier control point, although the reverse is NOT true. An exact conversion of a cubic Bézier curve to a quadratic Bézier curve is only possible if the cubic term is zero, more commonly a subdivision method is used to approximate a cubic Bézier using multiple quadratic Bézier curves.
bezierCurveTo example
// Bezier curves example
ctx.beginPath();
ctx.moveTo(75,40);
ctx.bezierCurveTo(75,37,70,25,50,25);
ctx.bezierCurveTo(20,25,20,62.5,20,62.5);
ctx.bezierCurveTo(20,80,40,102,75,120);
ctx.bezierCurveTo(110,102,130,80,130,62.5);
ctx.bezierCurveTo(130,62.5,130,25,100,25);
ctx.bezierCurveTo(85,25,75,37,75,40);
ctx.fill();
Firefox 1.5 quadraticCurveTo() bug workaround
There is a bug in the Firefox 1.5 implementation of quadatricCurveTo(). It does NOT draw a quadratic curve, as it is just calling the same cubic curve function bezierCurveTo() calls, and repeating the single quadratic control point (x,y) coordinate twice. For this reason quadraticCurveTo() will yield incorrect results. If you require the use of quadraticCurveTo() you must convert your quadratic Bézier curve to a cubic Bézier curve yourself, so you can use the working bezierCurveTo() method.
var currentX, currentY;  // set to last x,y sent to lineTo/moveTo/bezierCurveTo or quadraticCurveToFixed()

function quadraticCurveToFixed( cpx, cpy, x, y ) {
  /*
   For the equations below the following variable name prefixes are used:
     qp0 is the quadratic curve starting point (you must keep this from your last point sent to moveTo(), lineTo(), or bezierCurveTo() ).
     qp1 is the quadratic curve control point (this is the cpx,cpy you would have sent to quadraticCurveTo() ).
     qp2 is the quadratic curve ending point (this is the x,y arguments you would have sent to quadraticCurveTo() ).
   We will convert these points to compute the two needed cubic control points (the starting/ending points are the same for both
   the quadratic and cubic curves.

   The exact equations for the two cubic control points are:
     cp0 = qp0 and cp3 = qp2
     cp1 = qp0 + (qp1 - qp0) * ratio
     cp2 = cp1 + (qp2 - qp0) * (1 - ratio)
     where ratio = (sqrt(2) - 1) * 4 / 3 exactly (approx. 0.5522847498307933984022516322796)
                   if the quadratic is an approximation of an elliptic arc, and the cubic must approximate the same arc, or
           ratio = 2.0 / 3.0 for keeping the same quadratic curve.

   In the code below, we must compute both the x and y terms for each point separately.

    cp1x = qp0x + (qp1x - qp0x) * ratio;
    cp1y = qp0y + (qp1y - qp0y) * ratio;
    cp2x = cp1x + (qp2x - qp0x) * (1 - ratio);
    cp2y = cp1y + (qp2y - qp0y) * (1 - ratio);

   We will now
     a) replace the qp0x and qp0y variables with currentX and currentY (which *you* must store for each moveTo/lineTo/bezierCurveTo)
     b) replace the qp1x and qp1y variables with cpx and cpy (which we would have passed to quadraticCurveTo)
     c) replace the qp2x and qp2y variables with x and y.
   which leaves us with:
  */
  var ratio = 2.0 / 3.0; // 0.5522847498307933984022516322796 if the Bezier is approximating an elliptic arc with best fitting
  var cp1x = currentX + (cpx - currentX) * ratio;
  var cp1y = currentY + (cpy - currentY) * ratio;
  var cp2x = cp1x + (x - currentX) * (1 - ratio);
  var cp2y = cp1y + (y - currentY) * (1 - ratio);

  // and now call cubic Bezier curve to function
  bezierCurveTo( cp1x, cp1y, cp2x, cp2y, x, y );

  currentX = x;
  currentY = y;
}
Rectangles
Besides the three methods we saw above which draw rectangular shapes directly to the canvas, we also have a method rect which adds a rectangular path to the path list.
rect(x, y, width, height)
This method takes four arguments. The x and y parameters define the coordinate of the top left corner of the new rectangular path. width and height define the width and the height of the rectangle.
When this method is executed, the moveTo method is automatically called with the parameters (0,0) (i.e. it resets the starting point to its default location).
Making combinations
In all examples on this page I’ve only used one type of path function per shape. However there’s absolutely no limitation to the amount or type of paths you can use to create a shape. So in this last example I’ve tried to combine all of the path functions to make a set of very famous game characters.
Example
I’m not going to run through this complete script, but the most important things to note are the function roundedRect and the use of the fillStyle property. It can be very useful and time saving to define your own functions to draw more complex shapes. In this script it would have taken me twice as many lines of code as I have now.
We will look at the fillStyle property in greater depth later in this tutorial. Here I’m using it to change the fill color from the default black, to white, and back again.
function draw() {
  var ctx = document.getElementById('canvas').getContext('2d');
  roundedRect(ctx,12,12,150,150,15);
  roundedRect(ctx,19,19,150,150,9);
  roundedRect(ctx,53,53,49,33,10);
  roundedRect(ctx,53,119,49,16,6);
  roundedRect(ctx,135,53,49,33,10);
  roundedRect(ctx,135,119,25,49,10);

  ctx.beginPath();
  ctx.arc(37,37,13,Math.PI/7,-Math.PI/7,false);
  ctx.lineTo(31,37);
  ctx.fill();
  for(var i=0;i<8;i++){
    ctx.fillRect(51+i*16,35,4,4);
  }
  for(i=0;i<6;i++){
    ctx.fillRect(115,51+i*16,4,4);
  }
  for(i=0;i<8;i++){
    ctx.fillRect(51+i*16,99,4,4);
  }
  ctx.beginPath();
  ctx.moveTo(83,116);
  ctx.lineTo(83,102);
  ctx.bezierCurveTo(83,94,89,88,97,88);
  ctx.bezierCurveTo(105,88,111,94,111,102);
  ctx.lineTo(111,116);
  ctx.lineTo(106.333,111.333);
  ctx.lineTo(101.666,116);
  ctx.lineTo(97,111.333);
  ctx.lineTo(92.333,116);
  ctx.lineTo(87.666,111.333);
  ctx.lineTo(83,116);
  ctx.fill();
  ctx.fillStyle = "white";
  ctx.beginPath();
  ctx.moveTo(91,96);
  ctx.bezierCurveTo(88,96,87,99,87,101);
  ctx.bezierCurveTo(87,103,88,106,91,106);
  ctx.bezierCurveTo(94,106,95,103,95,101);
  ctx.bezierCurveTo(95,99,94,96,91,96);
  ctx.moveTo(103,96);
  ctx.bezierCurveTo(100,96,99,99,99,101);
  ctx.bezierCurveTo(99,103,100,106,103,106);
  ctx.bezierCurveTo(106,106,107,103,107,101);
  ctx.bezierCurveTo(107,99,106,96,103,96);
  ctx.fill();
  ctx.fillStyle = "black";
  ctx.beginPath();
  ctx.arc(101,102,2,0,Math.PI*2,true);
  ctx.fill();
  ctx.beginPath();
  ctx.arc(89,102,2,0,Math.PI*2,true);
  ctx.fill();
}
function roundedRect(ctx,x,y,width,height,radius){
  ctx.beginPath();
  ctx.moveTo(x,y+radius);
  ctx.lineTo(x,y+height-radius);
  ctx.quadraticCurveTo(x,y+height,x+radius,y+height);
  ctx.lineTo(x+width-radius,y+height);
  ctx.quadraticCurveTo(x+width,y+height,x+width,y+height-radius);
  ctx.lineTo(x+width,y+radius);
  ctx.quadraticCurveTo(x+width,y,x+width-radius,y);
  ctx.lineTo(x+radius,y);
  ctx.quadraticCurveTo(x,y,x,y+radius);
  ctx.stroke();
}
Attributions
This article contains content originally from external sources, including ones licensed under the CC-BY-SA license.

Portions of this content copyright 2012 Mozilla Contributors. This article contains work licensed under the Creative Commons Attribution-Sharealike License v2.5 or later. The original work is available at Mozilla Developer Network: Article