Using transformations in canvas
Summary
This part of the canvas tutorial is going through 2D coordinate transformations. It gives examples for the three basic transformation methods translate, rotate and scale, which can be used stacked or all-in-one per matrix multiplication.
Saving and restoring state
Before we look at the transformation methods, I’ll introduce two other methods which are indispensable once you start generating ever more complex drawings.
save()
restore()
The canvas save and restore methods are used to save and retrieve the canvas state. The canvas drawing state is basically a snapshot of all the styles and transformations that have been applied. Both methods take no parameters.
Canvas states are stored on a stack. Every time the save method is called, the current drawing state is pushed onto the stack. A drawing state consists of
- The transformations that have been applied (i.e. translate, rotate and scale - see below).
- The values of
strokeStyle,fillStyle,globalAlpha,lineWidth,lineCap,lineJoin,miterLimit,shadowOffsetX,shadowOffsetY,shadowBlur,shadowColor,globalCompositeOperationproperties. - The current clipping path, which we’ll see in the next section.
You can call the save method as many times as you like.
Every time the restore method is called, the last saved state is returned from the stack and all saved settings are restored.
A save and restore canvas state example
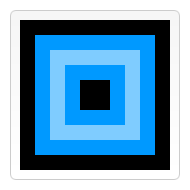
This example tries to illustrate how the stack of drawing states functions by drawing a set of consecutive rectangles.
The first step is to draw a large rectangle with the default settings. Next we save this state and make changes to the fill color. We then draw the second and smaller blue rectangle and save the state. Again we change some drawing settings and draw the third semi-transparent white rectangle.
So far this is pretty similar to what we’ve done in previous sections. However once we call the first restore statement, the top drawing state is removed from the stack, and settings are restored. If we hadn’t saved the state using save, we would need to change the fill color and transparency manually in order to return to the previous state. This would be easy for two properties, but if we have more than that, our code would become very long, very fast.
When the second restore statement is called, the original state (the one we set up before the first call to save) is restored and the last rectangle is once again drawn in black.
function draw() {
  var ctx = document.getElementById('canvas').getContext('2d');

  ctx.fillRect(0,0,150,150);   // Draw a rectangle with default settings
  ctx.save();                  // Save the default state

  ctx.fillStyle = '#09F'       // Make changes to the settings
  ctx.fillRect(15,15,120,120); // Draw a rectangle with new settings

  ctx.save();                  // Save the current state
  ctx.fillStyle = '#FFF'       // Make changes to the settings
  ctx.globalAlpha = 0.5;
  ctx.fillRect(30,30,90,90);   // Draw a rectangle with new settings

  ctx.restore();               // Restore previous state
  ctx.fillRect(45,45,60,60);   // Draw a rectangle with restored settings

  ctx.restore();               // Restore original state
  ctx.fillRect(60,60,30,30);   // Draw a rectangle with restored settings
}
Translating
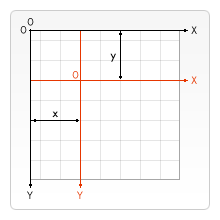
The first of the transformation methods we’ll look at is translate. This method is used to move the canvas and its origin to a different point in the grid.
translate(x, y)
This method takes two arguments. x is the amount the canvas is moved to the left or right, and y is the amount it’s moved up or down (illustrated by the image on the right).
It’s a good idea to save the canvas state before doing any transformations. In most cases, it is just easier to call the restore method than having to do a reverse translation to return to the original state. Also if you’re translating inside a loop and don’t save and restore the canvas state, you might end up missing part of your drawing, because it was drawn outside the canvas edge.
A translate example
This example demonstrates some of the benefits of translating the canvas origin. I’ve made a function drawSpirograph that draws spirograph patterns. These are drawn around the origin. If I didn’t use the translate function, I would only see a quarter of the pattern on the canvas. The translate method also gives me the freedom to place it anywhere on the canvas without having to manually adjust coordinates in the spirograph function. This makes it a little easier to understand and use.
In the draw function I call the drawSpirograph nine times using two for loops. In each loop the canvas is translated, the spirograph is drawn, and the canvas is returned back to its original state.
function draw() {
  var ctx = document.getElementById('canvas').getContext('2d');
  ctx.fillRect(0,0,300,300);
  for (var i=0;i<3;i++) {
    for (var j=0;j<3;j++) {
      ctx.save();
      ctx.strokeStyle = "#9CFF00";
      ctx.translate(50+j*100,50+i*100);
      drawSpirograph(ctx,20*(j+2)/(j+1),-8*(i+3)/(i+1),10);
      ctx.restore();
    }
  }
}
function drawSpirograph(ctx,R,r,O){
  var x1 = R-O;
  var y1 = 0;
  var i  = 1;
  ctx.beginPath();
  ctx.moveTo(x1,y1);
  do {
    if (i>20000) break;
    var x2 = (R+r)*Math.cos(i*Math.PI/72) - (r+O)*Math.cos(((R+r)/r)*(i*Math.PI/72))
    var y2 = (R+r)*Math.sin(i*Math.PI/72) - (r+O)*Math.sin(((R+r)/r)*(i*Math.PI/72))
    ctx.lineTo(x2,y2);
    x1 = x2;
    y1 = y2;
    i++;
  } while (x2�!= R-O && y2�!= 0 );
  ctx.stroke();
}
Rotating
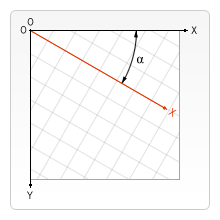
The second transformation method is rotate. We use it to rotate the canvas around the current origin.
rotate(angle)
This method only takes one parameter and that’s the angle the canvas is rotated by. This is a clockwise rotation measured in radians (illustrated in the image on the right).
The rotation center point is always the canvas origin. To change the center point, we will need to move the canvas by using the translate method.
A rotate example
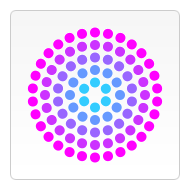
In the example, you can see on the right, I used the rotate method to draw shapes in a circular pattern. You could also have calculated the individual x and y coordinates (x = r*Math.cos(a); y = r*Math.sin(a)). In this case it doesn’t really matter which method you choose, because we’re drawing circles. Calculating the coordinates results in only rotating the center positions of the circles and not the circles themselves, while using rotate results in both, but of course circles look the same no matter how far they are rotated about their centers.
Again we have two loops. The first determines the number of rings, and the second determines the number of dots drawn in each ring. Before drawing each ring, I save the canvas state, so I can easily retrieve it. For each dot that is drawn, I rotate the canvas coordinate space by an angle that is determined by the number of dots in the ring. The innermost circle has six dots, so in each step, I rotate over an angle of 360/6 = 60 degrees. With each additional ring, the number of dots is doubled, and the angle in turn is halved.
function draw() {
  var ctx = document.getElementById('canvas').getContext('2d');
  ctx.translate(75,75);

  for (var i=1;i<6;i++){ // Loop through rings (from inside to out)
    ctx.save();
    ctx.fillStyle = 'rgb('+(51*i)+','+(255-51*i)+',255)';

    for (var j=0;j<i*6;j++){ // draw individual dots
      ctx.rotate(Math.PI*2/(i*6));
      ctx.beginPath();
      ctx.arc(0,i*12.5,5,0,Math.PI*2,true);
      ctx.fill();
    }

    ctx.restore();
  }
}
Scaling
The next transformation method is scaling. We use it to increase or decrease the units in our canvas grid. This can be used to draw scaled down or enlarged shapes and bitmaps.
scale(x, y)
This method takes two parameters. x is the scale factor in the horizontal direction and y is the scale factor in the vertical direction. Both parameters must be real numbers, and not necessarily positive. Values smaller than 1.0 reduce the unit size and values larger than 1.0 increase the unit size. Setting the scaling factor to precisely 1.0 doesn’t affect the unit size. Using negative numbers you can do axis mirroring (for example using translate(0,canvas.height); scale(1,-1); you will have the well known Cartesian coordinate system, with origin in the bottom left corner).
By default one unit on the canvas is exactly one pixel. If we apply, for instance, a scaling factor of 0.5, the resulting unit would become 0.5 pixels and so shapes would be drawn at half size. In a similar way setting the scaling factor to 2.0 would increase the unit size and one unit now becomes two pixels. This results in shapes being drawn twice as large.
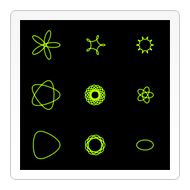
A scale example
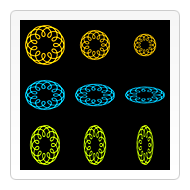
In this last example I’ve used the spirograph function from one of the previous examples to draw nine shapes with different scaling factors. The top left shape has been drawn with no scaling applied. The yellow shapes to the right both have a uniform scaling factor (the same value for x and y parameters). If you look at the code below you’ll see that I’ve used the scale method twice with equal parameter values for the second and third spirograph. Because I didn’t restore the canvas state, the third shape is drawn with a scaling factor of 0.75 � 0.75 = 0.5625.
The second row of blue shapes have a non-uniform scaling applied in a vertical direction. Each of the shapes has the x scaling factor set to 1.0 which means no scaling. The y scaling factor is set to 0.75. This results in the three shapes being squashed down. The original circular shape has now become an ellipse. If you look closely you’ll see that the line width has also been reduced in the vertical direction.
The third row of green shapes is similar to the one above but now I’ve applied a scaling in the horizontal direction.
function draw() {
  var ctx = document.getElementById('canvas').getContext('2d');
  ctx.strokeStyle = "#fc0";
  ctx.lineWidth = 1.5;
  ctx.fillRect(0,0,300,300);

  // Uniform scaling
  ctx.save()
  ctx.translate(50,50);
  drawSpirograph(ctx,22,6,5);  // no scaling

  ctx.translate(100,0);
  ctx.scale(0.75,0.75);
  drawSpirograph(ctx,22,6,5);

  ctx.translate(133.333,0);
  ctx.scale(0.75,0.75);
  drawSpirograph(ctx,22,6,5);
  ctx.restore();

  // Non-uniform scaling (y direction)
  ctx.strokeStyle = "#0cf";
  ctx.save()
  ctx.translate(50,150);
  ctx.scale(1,0.75);
  drawSpirograph(ctx,22,6,5);

  ctx.translate(100,0);
  ctx.scale(1,0.75);
  drawSpirograph(ctx,22,6,5);

  ctx.translate(100,0);
  ctx.scale(1,0.75);
  drawSpirograph(ctx,22,6,5);
  ctx.restore();

  // Non-uniform scaling (x direction)
  ctx.strokeStyle = "#cf0";
  ctx.save()
  ctx.translate(50,250);
  ctx.scale(0.75,1);
  drawSpirograph(ctx,22,6,5);

  ctx.translate(133.333,0);
  ctx.scale(0.75,1);
  drawSpirograph(ctx,22,6,5);

  ctx.translate(177.777,0);
  ctx.scale(0.75,1);
  drawSpirograph(ctx,22,6,5);
  ctx.restore();

}
Transforms
The final transformation methods allow modifications directly to the transformation matrix.
transform(m11, m12, m21, m22, dx, dy)
This method must multiply the current transformation matrix with the matrix described by:
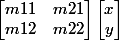
m11    m21     dx
m12     m22     dy
0   0   1
If any of the arguments are Infinity the transformation matrix must be marked as infinite instead of the method throwing an exception.
setTransform(m11, m12, m21, m22, dx, dy)
This method must reset the current transform to the identity matrix, and then invoke the transform method with the same arguments.
transform / setTransform examples
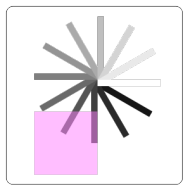
function draw() {
  var canvas = document.getElementById("canvas");
  var ctx = canvas.getContext("2d");

  var sin = Math.sin(Math.PI/6);
  var cos = Math.cos(Math.PI/6);
  ctx.translate(200, 200);
  var c = 0;
  for (var i=0; i <= 12; i++) {
    c = Math.floor(255 / 12 * i);
    ctx.fillStyle = "rgb(" + c + "," + c + "," + c + ")";
    ctx.fillRect(0, 0, 100, 10);
    ctx.transform(cos, sin, -sin, cos, 0, 0);
  }

  ctx.setTransform(-1, 0, 0, 1, 200, 200);
  ctx.fillStyle = "rgba(255, 128, 255, 0.5)";
  ctx.fillRect(0, 50, 100, 100);
}
Attributions
This article contains content originally from external sources, including ones licensed under the CC-BY-SA license.

Portions of this content copyright 2012 Mozilla Contributors. This article contains work licensed under the Creative Commons Attribution-Sharealike License v2.5 or later. The original work is available at Mozilla Developer Network: Article