Compositing
Summary
Here we explain how to combine shapes. There are examples about how to logically add/subtract/layer shapes and about how to use clipping paths.
Introduction
In all of our previous examples, shapes were always drawn one on top of the other. This is more than adequate for most situations. This, for instance, limits in what order composite shapes are built up. We can however change this behaviour by setting the globalCompositeOperation property.
globalCompositeOperation
We can not only draw new shapes behind existing shapes but we can also use it to mask off certain areas, clear sections from the canvas (not limited to rectangles like the clearRect method does) and more.
globalCompositeOperation = type
type is a string representing any one of twelve compositing operations. Each of the available types is described below.
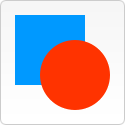
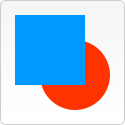
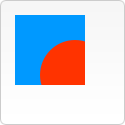
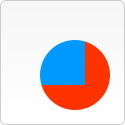
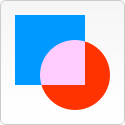
Note: In all of the examples below the blue square is drawn first and referred to as 'existing canvas content’. The red circle is drawn second and referred to as 'new shape’.
source-over (default) |
|
destination-over |
|
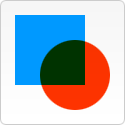
source-in |
|
destination-in |
|
source-out |
|
destination-out |
|
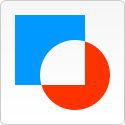
source-atop |
|
destination-atop |
|
lighter |
|
darker Unimplemented This value is supported until (Firefox 3.6 / Thunderbird 3.1 / Fennec 1.0). Support has been removed from later versions (due to removal from the canvas specification). |
|
xor |
|
copy |
|


Note: Currently the copy setting doesn’t do anything in the Gecko 1.8 based browsers (Firefox 1.5 betas, etc).
Clipping paths
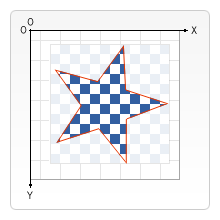
A clipping path is like a normal canvas shape but it acts as a mask to hide unwanted parts of shapes. This is visualized in the image on the right. The red star shape is our clipping path. Everything that falls outside of this path won’t get drawn on the canvas.
If we compare clipping paths to the globalCompositeOperation property we’ve seen above; settings that achieve more or less the same effect are source-in and source-atop. The most important differences between the two are that clipping paths are never actually drawn to the canvas and the clipping path is never affected by adding new shapes. This makes clipping paths ideal for drawing multiple shapes in a restricted area.
In the chapter about [canvas/tutorial/Canvas tutorial/Drawing shapes] I only mentioned the stroke and fill methods, but there’s a third method we can use with paths, called clip.
clip()
We use the clip method to create a new clipping path. By default the canvas element has a clipping path that’s the exact same size as the canvas itself (i.e. no clipping occurs).
A clip example
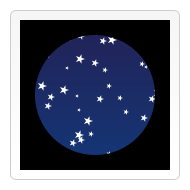
In this example I’ll be using a circular clipping path to restrict the drawing of a set of random stars to a particular region.
In the first few lines of code I draw a black rectangle the size of the canvas as a backdrop and translate the origin to the center. Below this I create the circular clipping path by drawing an arc. By calling the clip method the clipping path is created. Clipping paths are also part of the canvas save state. If we wanted to keep the original clipping path we could have saved the canvas state before creating the new one.
Everything that’s drawn after creating the clipping path will only appear inside that path. You can see this clearly in the linear gradient that’s drawn next. After this a set of 50 randomly positioned and scaled stars is drawn (I’m using a custom function for this). Again the stars only appear inside the defined clipping path.
Note: Need a link to a sample page, as done on the original site
function draw() {
  var ctx = document.getElementById('canvas').getContext('2d');
  ctx.fillRect(0,0,150,150);
  ctx.translate(75,75);

  // Create a circular clipping path
  ctx.beginPath();
  ctx.arc(0,0,60,0,Math.PI*2,true);
  ctx.clip();

  // draw background
  var lingrad = ctx.createLinearGradient(0,-75,0,75);
  lingrad.addColorStop(0, '#232256');
  lingrad.addColorStop(1, '#143778');

  ctx.fillStyle = lingrad;
  ctx.fillRect(-75,-75,150,150);

  // draw stars
  for (var j=1;j<50;j++){
    ctx.save();
    ctx.fillStyle = '#fff';
    ctx.translate(75-Math.floor(Math.random()*150),
                  75-Math.floor(Math.random()*150));
    drawStar(ctx,Math.floor(Math.random()*4)+2);
    ctx.restore();
  }

}
function drawStar(ctx,r){
  ctx.save();
  ctx.beginPath()
  ctx.moveTo(r,0);
  for (var i=0;i<9;i++){
    ctx.rotate(Math.PI/5);
    if(i%2 == 0) {
      ctx.lineTo((r/0.525731)*0.200811,0);
    } else {
      ctx.lineTo(r,0);
    }
  }
  ctx.closePath();
  ctx.fill();
  ctx.restore();
}
Attributions
This article contains content originally from external sources, including ones licensed under the CC-BY-SA license.

Portions of this content copyright 2012 Mozilla Contributors. This article contains work licensed under the Creative Commons Attribution-Sharealike License v2.5 or later. The original work is available at Mozilla Developer Network: Article