HTML tables
Summary
This article offers an introduction to HTML tables, including basic coding techniques and CSS styling.
Introduction
Ack! — how do you use web standards to organize reams of data? The very idea of using tons of nested elements to get all your data into nice little rows and boxes might put your brain into panic mode, but there is a solution — HTML tables to the rescue!
In web design, tables are a good way to organize data into a tabular form. You see them all the time on websites, whether they are giving a summary or comparison of political election results, sports statistics, price comparisons, size charts, or other data.
Back in the Jurassic Age of the Internet, before CSS was popularized as a method of separating HTML presentation from structure, tables were used as a way to lay out web pages — to create columns, boxes, and general areas in which to arrange the page content. This is, of course, the wrong way to go about it; using tables for page layout results in bloated, messy pages with tons of nested tables that produce larger file sizes, are hard to code initially, and nearly impossible to maintain later. Today, you should only use tables for presenting tabular data, and use CSS to control page layout.
From an information design standpoint, tables always perform one of two functions: they either reflect the structure of organized data, or they impart structure to unorganized data. If an HTML table doesn’t do one of those jobs, it probably shouldn’t be a table.
The most basic table
Let’s start with the semantic HTML code required to render a basic table. This example compares recent volcanic eruptions in the Pacific region of North America:
<table>
    <tr>
        <td>Volcano Name</td>
        <td>Location</td>
        <td>Last Major Eruption</td>
        <td>Type of Eruption</td>
    </tr>
    <tr>
        <td>Mt. Lassen</td>
        <td>California</td>
        <td>1914-17</td>
        <td>Explosive Eruption</td>
    </tr>
    <tr>
        <td>Mt. Hood</td>
        <td>Oregon</td>
        <td>1790s</td>
        <td>Pyroclastic flows and Mudflows</td>
    </tr>
    <tr>
        <td>Mt .St. Helens</td>
        <td>Washington</td>
        <td>1980</td>
        <td>Explosive Eruption</td>
    </tr>
</table>
Bearing in mind that browser and rendering environment defaults (such as those in Web Platform Docs pages!) may significantly affect visual table styling, the above table might render like this:
||
|Volcano Name|Location|Last Major Eruption|Type of Eruption|
|Mt. Lassen|California|1914-17|Explosive Eruption|
|Mt. Hood|Oregon|1790s|Pyroclastic flows and Mudflows|
|Mt .St. Helens|Washington|1980|Explosive Eruption|
Let’s start by breaking down the HTML markup used in the above code:
<table></table>: The<table>wrapper element tells the browser that the content is a table.<tr></tr>: The<tr>element establishes a table row. This allows the browser to organize any content between the<tr>and</tr>tags in a horizontal fashion; that is, in rows.<td></td>: The<td>element defines the table data cell or each individual “box” for content within the row. Only use as many<td>table cells as needed for actual data. Don’t use empty<td>cells for white space or padding — use CSS instead. This is not only a good way to separate presentation from structure, but keeping the HTML clean and simple makes the table easier to understand for people with visual impairments who are using screen readers.
Note that there is no “table column” (<tc>) element in the sample code; in fact, there is no such element in HTML. Columns are a logical construct, not a physical one. We seem to see columns in a properly constructed table, but they aren’t actually coded, they are merely implied by the alignment of the data cells.
The basic table elements must be nested as follows:
<table>
    <tr>
        <td>content</td>
        <td>content</td>
        <td>content</td>
    </tr>
</table>
To order them in any other way will cause the browser to spit up the equivalent of an Internet hair ball and render the table oddly, if at all.
Adding some more features
Now that the basic table is in place, we can add some slightly more complex table features. First, we’ll add a caption and table headers to help improve the data, both in terms of semantics and legibility for screen readers. The updated table markup looks like this:
<table>
    <caption>Recent Major Volcanic Eruptions in the Pacific Northwest</caption>
    <tr>
        <th>Volcano Name</th>
        <th>Location</th>
        <th>Last Major Eruption</th>
        <th>Type of Eruption</th>
    </tr>
    <tr>
        <td>Mt. Lassen</td>
        <td>California</td>
        <td>1914-17</td>
        <td>Explosive Eruption</td>
    </tr>
    <tr>
        <td>Mt. Hood</td>
        <td>Oregon</td>
        <td>1790s</td>
        <td>Pyroclastic flows and Mudflows</td>
    </tr>
    <tr>
        <td>Mt. St. Helens</td>
        <td>Washington</td>
        <td>1980</td>
        <td>Explosive Eruption</td>
    </tr>
</table>
This code is (which is to say, "might be", again depending on environment) rendered as:
| Volcano Name | Location | Last Major Eruption | Type of Eruption |
|---|---|---|---|
| Mt. Lassen | California | 1914-17 | Explosive Eruption |
| Mt. Hood | Oregon | 1790s | Pyroclastic flows and Mudflows |
| Mt. St. Helens | Washington | 1980 | Explosive Eruption |
The new elements used here are:
<caption></caption>: The<caption>element allows you to give the table data a caption. Most browsers will center the caption and render it the same width as the table by default.<th></th>: The<th>element defines the content as table headings for each table section, which can be a column, a row, or a group of cells. This is useful not just to help semantically describe the function of the content, but it also helps render it more accurately in a variety of browsers and devices. The<th>element is used in a row just like a<td>, and browsers typically render its content bold and centered in the data cell.
Structuring the table further
As a final step in structuring our table, we will define table header and table body sections, add a footer, and define the scope of row and column headings. We will also add a summary attribute to describe the table contents. The final markup looks like this:
<table summary="a summary of recent major volcanic eruptions in the Pacific Northwest">
    <caption>Recent Major Volcanic Eruptions in the Pacific Northwest</caption>
    <thead>
        <tr>
            <th scope="col">Volcano Name</th>
            <th scope="col">Location</th>
            <th scope="col">Last Major Eruption</th>
            <th scope="col">Type of Eruption</th>
        </tr>
    </thead>
    <tfoot>
        <tr>
            <td colspan="4">Compiled in 2008 by Ms Jen</td>
        </tr>
    </tfoot>
    <tbody>
        <tr>
            <th scope="row">Mt. Lassen</th>
            <td>California</td>
            <td>1914-17</td>
            <td>Explosive Eruption</td>
        </tr>
        <tr>
            <th scope="row">Mt. Hood</th>
            <td>Oregon</td>
            <td>1790s</td>
            <td>Pyroclastic flows and Mudflows</td>
        </tr>
        <tr>
            <th scope="row">Mt. St. Helens</th>
            <td>Washington</td>
            <td>1980</td>
            <td>Explosive Eruption</td>
        </tr>
    </tbody>
</table>
This table code renders (again, “might render”) like this:
| Volcano Name | Location | Last Major Eruption | Type of Eruption |
|---|---|---|---|
| Mt. Lassen | California | 1914-17 | Explosive Eruption |
| Mt. Hood | Oregon | 1790s | Pyroclastic flows and Mudflows |
| Mt. St. Helens | Washington | 1980 | Explosive Eruption |
| Compiled in 2008 by Ms Jen |
- The
<thead>,<tbody>and<tfoot>elements: These define the table’s header, body, and footer, respectively. Unless you are coding a really complex table with many columns and rows of data, using these may be overkill. In a complex table, however, they can add useful structure for the developers, and also for browsers and other devices. - The
colspanandrowspanattributes: Thecolspanattribute creates a table cell that spans more than one column. Here, we wanted the footer table cell to span the whole width of the table, so we told it to span four columns across a row. Alternately, you can add a table cellrowspanattribute that will allow the table cell to span a number of rows down a column, for example<td rowspan="3">. - The
summaryattribute: This attribute is used to define a summary of the table contents, primarily for use by screenreaders (you won’t see it in the rendered version of the table above). Note that in the older W3C recommendations, WCAG 1.0 and HTML 4.0, you can use thesummaryattribute as detailed above. In newer drafts of the specs, however, thesummaryattribute is not mentioned. Whether to still use thesummaryattribute seems undecided, so for now let’s say that it is safe to still use it. After all, it doesn’t cause anything to break, and it confers accessibility advantages. - The
scopeattribute: You may also have noticed thescopeattributes in thethtags, and the fact that we have defined the volcano names as headings as well, inside the data rows! Thescopeattribute can be used in thethelement to tell screen readers that thethcontent is the title for a column or a row.
CSS to the rescue: a better looking table
The above elements and attributes are all that is necessary to code a good data table. Now that the HTML structure is in place, let’s look at some simple CSS to make the table look a bit nicer:
body {
    background: #ffffff;
    margin: 0;
    padding: 20px;
    line-height: 1.4em;
    font-family: tahoma, arial, sans-serif;
    font-size: 62.5%;
}

table {
    width: 80%;
    margin: 0;
    background: #FFFFFF;
    border: 1px solid #333333;
    border-collapse: collapse;
}

td, th {
    border-bottom: 1px solid #333333;
    padding: 6px 16px;
    text-align: left;
}

th {
    background: #EEEEEE;
}

caption {
    background: #E0E0E0;
    margin: 0;
    border: 1px solid #333333;
    border-bottom: none;
    padding: 6px 16px;
    font-weight: bold;
}
When applied to our final table markup, the table looks like this (we used an image here so our markup wouldn’t be affected by the rendering environment):
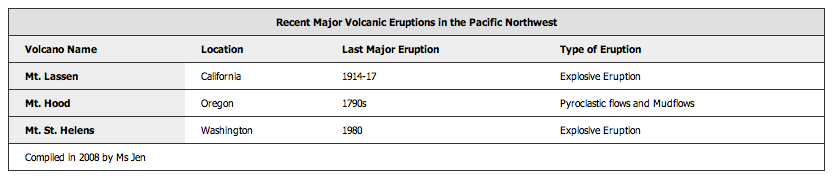
Figure 1: A more visually appealing table.
Ahh, much better. You can choose to style the table any way you want, but the above sample provides a baseline to work with. For now let’s briefly break down what each section of this CSS is doing:
<body>: In the above CSS, we have added properties to set the margin (to zero in this case), padding to give a little room, background colour (white), font size, and font family, as well as the line height to also give a little breathing room. Try altering the property values in the CSS to see how things change.<table>: Borders have been added using the CSSborderproperty. To make this work correctly, we also had to set theborder-collapseproperty tocollapse, to reset the border values in the table and allow theborder-bottomto be a straight rule line across the whole row rather than being broken up at the end of each table cell. Awidthof 80% was chosen for this example (this makes the table extend across 80% of the screen width).<th>and<td>: In the above CSS, we settext-alignto beleft, but you could set it tocenteror other values if you like. We also gave both the<th>and<td>a bit of padding to open up the rows and allow for greater readability. In the case of the<th>selector, we used another color to differentiate the headings from the rest of the table.<caption>: In the example we gave the caption a border (with no bottom border, as the border in the table already provides it), a different background colour, and bold type to set the caption apart from the table header row.
Conclusion
In this article we have presented all you need to know to create basic HTML data tables. Let’s leave this article with some pertinent thoughts:
- It is important that tables are correctly coded to be readable by a variety web browsers, mobile, accessible, and other devices. Table HTML is best kept to a minimum, and you should use CSS to style the tables.
- Tables can be made accessible to mobile devices and users that use screen reading software by keeping the code clean, using attributes such as
scopeandsummaryas well as the<caption>element to help announce clearly and semantically what the sections are for. Also important for accessibility is to not use empty table cells for spacing; use CSS instead.