Introduction to Chrome developer tools, part one
By Seth Ladd
Originally published June 18, 2010
Summary
An introduction to Chrome Developer Tools.
Introduction
Google Chrome is a rich and powerful web browser, pioneering what is possible for applications on the web. Google has worked hard to deliver a very fast, very stable, feature rich browsing experience for end users. Google has also ensured that developers like you have a great experience with Chrome. The Developer Tools, bundled and available in Chrome and Safari, allow web developers and programmers deep access into the internals of the browser and their web applications.
The Developer Tools are part of the open source Webkit project. Most of the discussion in this article applies to both Google Chrome and Safari. However, the screen shots were taken using Google Chrome 6, so there may be slight differences in your browser.
In this article, we will take an overview tour of Developer Tools and point out their most popular and useful features. Our target audience is web developers who did not know of, or have not yet investigated, the Developer Tools. However, we are sure that even if you are an experienced web developer, you will pick up a tip or two.
If your instance of Developer Tools does not quite match the screen shots found in this article, we recommend you upgrade to a newer version so you can follow along and gain access to all of the features described here.
Overview
Overall, there are eight main groups of tools available in Developer Tools, and the capabilities are being extended with every release. Chrome now offers Elements, Resources, Scripts, Timeline, Profiles, Storage, Audits, and Console.
Elements
Elements tab 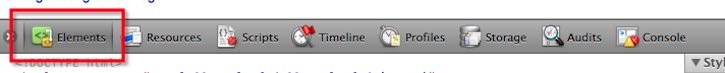
The Elements tool allows you to see the web page as the browser sees it. That is, using the Elements tool, you can see the raw HTML, raw CSS styles, the Document Object Model, and manipulate any of them in real time.
Resources
Resources tab 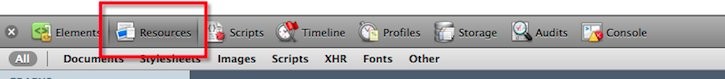
Use the Resources tool to learn what components your web page or application is requesting from web servers, how long these requests take, and how much bandwidth is required. You can also view the HTTP request and response headers for each of your resources. The Resources tool is perfect for helping you speed up page load times.
Scripts
Scripts tab 
To peer inside the JavaScript for a page, you use the Scripts tool. Here you can find a list of scripts required by the page plus a full featured script debugger. You can even change the JavaScript on the fly!
Timeline
Timeline tab 
For advanced timing and speed analysis, the Timeline tool offers in-depth visibility into various Chrome behind-the-scenes activities. You can learn how long the browser takes to handle DOM events, render page layouts, and paint the window.
Profiles
Profiles tab 
The Profiles tool helps you capture and analyze the performance of JavaScript scripts. For example, you can learn which functions take the most time to execute and zero in on exactly where to optimize.
Storage
Storage tab 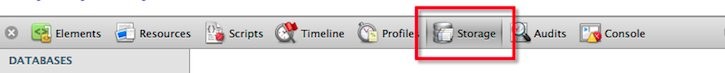
Modern web applications require more persistence than simply cookies, and the Storage tool helps you track, query, and debug local browser storage. This tool can display and query data stored in local databases, local storage, session storage, and cookies.
Audit
Audit tab 
The Audit tool is like having your own web optimization consultant sitting next to you. This tool can analyze a page as it loads and provide suggestions and optimizations for decreasing page load time and increase perceived (and real) responsiveness.
Console
Console tab 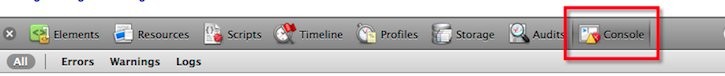
Last but definitely not least, the Developer Tools offer a full featured Console. From the Console, you can enter arbitrary JavaScript and programmatically interact with your page.
Starting Up
It’s easy to start the Developer Tools while inside Chrome.
For any operating system, you can simply right-click on any element in the page and select the Inspect Element option from the context menu. This will open the Developer Tools and drill down right to the element you clicked on.
To see this in action, visit http://www.google.com in the Chrome browser. Right click on the Google logo, and you will see the following options:
Opening the inspector 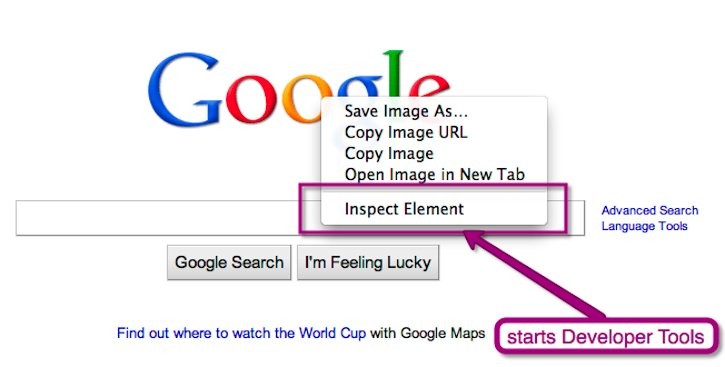
Selecting Inspect Element will bring up the Developer Tools, which should look like the following:
Inside the element inspector 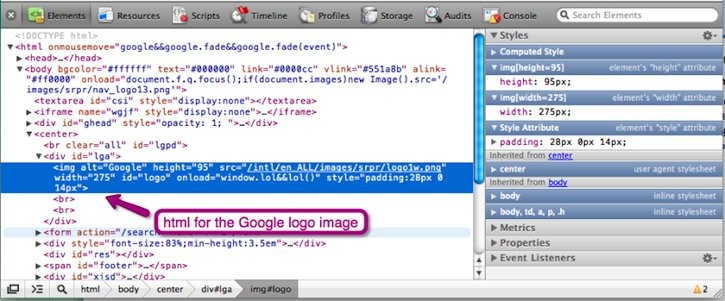
Notice how the Developer Tools opens inside of the Elements tab and automatically drills down to, and highlights, the <img> tag for the Google logo. This is very useful when you are curious which HTML generated a particular page element.
You may also open the Developer Tools with a simple keyboard shortcut. Depending on your operating system, try the following:
- On Windows and Linux, press Control-Shift-J.
- On Mac, press Command-Option-J.
Finally, you can choose to open the Developer Tools from the main browser menu.
On a Mac, and from the main application menu bar, select View > Developer > Developer Tools.
Opening the Developer Tools on a Mac 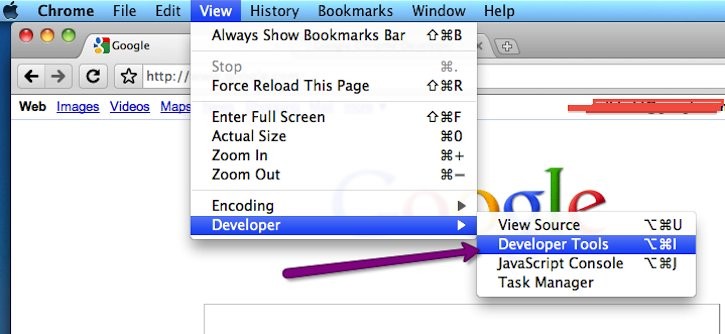
On a Windows PC, you should use the Page menu at the top right, and select Developer > Developer Tools.
Opening the Developer Tools on Windows 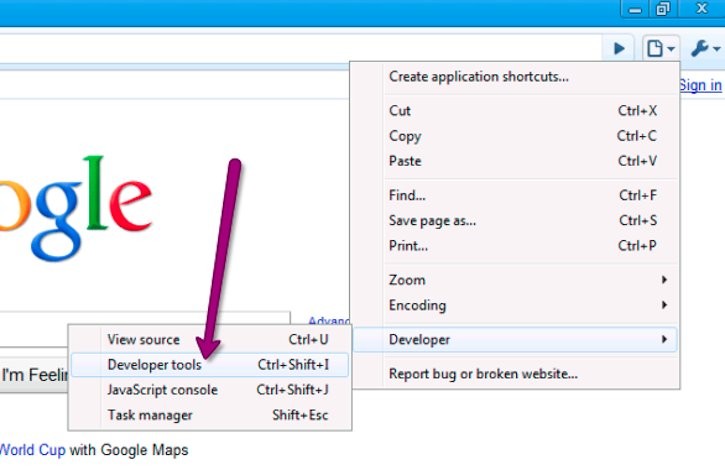
Now that you have the Developer Tools open and ready, let’s begin by exploring the elements on Google’s homepage.
Elements
Selecting the Elements tab 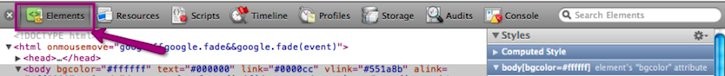
The first tab in the Developer Tools is Elements. This is your window into the structure of the web page, presented as your browser sees it.
DOM Browsing
You will often visit the Elements tab when you need to identify the HTML snippet for some aspect of the page. For example, you may be curious if an image has an HTML id attribute, and what that attribute’s value is.
The Elements tab is sometimes a better way to “view source” for a page. Inside the Elements tab, the page’s DOM will be nicely formatted, showing you HTML elements, their ancestors, and their descendants. Too often, pages you visit will have minified or simply ugly HTML which makes it hard to see how the page is structured. The Elements tab is your solution for viewing the real underlying structure of the page.
For example, the following is the output from the “view source” of the Google homepage.
Google.com’s minified source 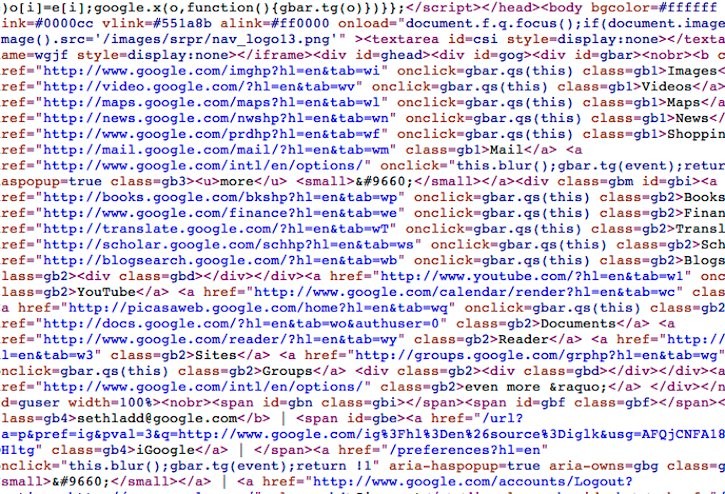
It’s hard to read the source because it is optimized and minified. The format is good for clients and servers, but difficult for developers!
Instead, when you want to read the source of a page, use the Elements Tab to view a pretty-printed, syntax-highlighted element hierarchy.
The Elements inspector pretty-printed HTML 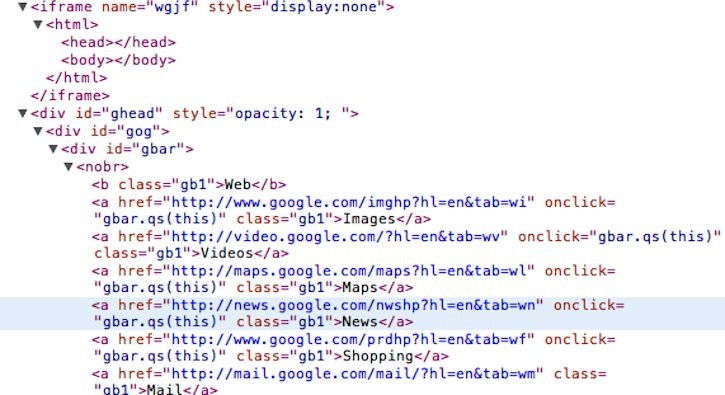
The Elements tab also allows you to browse, interact, and sometimes even change the Styles, Metrics, Properties, and Event Listeners for any element on the page.
Styles Browsing
The cascading nature of CSS makes the Styles browser in the Elements tab very useful. Sometimes, styles collapse onto themselves and unintended visuals appear. Knowing which style rule the browser is applying to the element helps you debug such an issue.
Clicking on any element in the Elements tab displays all the styles attached to that element.
CSS styling in the inspector 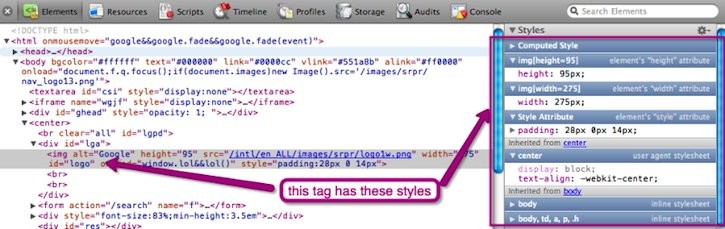
You’ll see in the screen shot above that we’re able to identify all the style attributes that are being applied. For example, the padding comes directly from the <img> element’s style attribute. The width and height, however, come from their respective native attributes. Interestingly, you can tell there are also styles inherited from the >center< tag, the >body< tag, and others.
While it’s great to see the individual styles and where they come from, it’s also very useful to see the final set of styles after they are computed and applied to the element. You can see the final product by selecting the Computed Style menu, as shown in the screenshot below.
Browser computed styles are also displayed 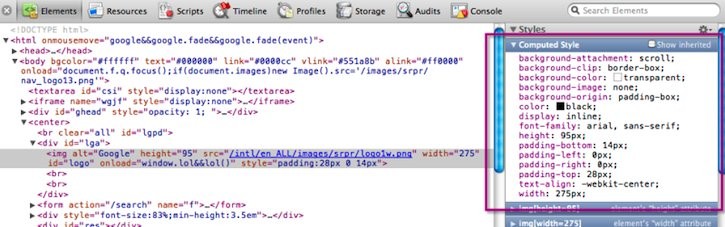
Next, we’ll take a brief look at the other features provided by the Elements tab. We’ll cover the following in more detail in future articles.
Box Model
You can see the box model as it is applied to the selected element by selecting the Metrics menu:
Viewing an element’s box model 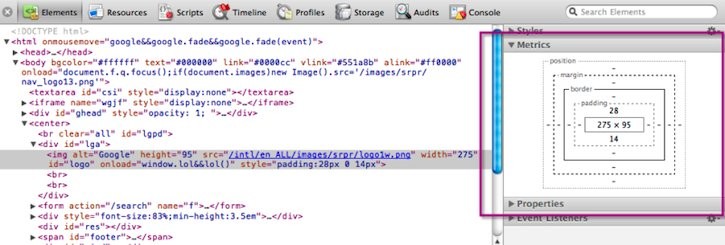
Element Properties
You can see all of the properties of the element as JavaScript and the DOM would see it by selecting the Properties menu:
Viewing DOM element properties 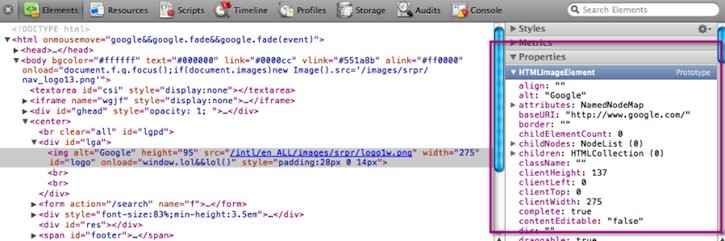
Event Listeners
And finally, you can even see the event listeners attached to, or that bubble through, the element via the Event Listeners menu:
Viewing DOM element event listeners 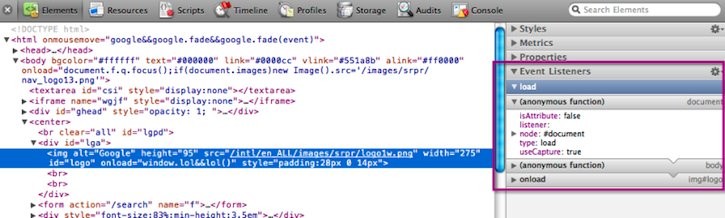
Summary
There is a lot of functionality available via the Elements tab, and future articles will dive deeper into the individual menus.
You should use the Elements tab when you want to see how the page looks to the browser itself. Common questions such as “How is this style computed?” or “What HTML tags generated this component?” are quickly and easily answered via the Elements tab.
Think of the Elements tab like an uber-"view source", allowing you to gain very sharp visibility into your page.
After you’ve investigated the page, you might be wondering how the HTML, CSS, and images got there in the first place. The Resources tab, described next, shows you how the client browser and web server communicate to send over those resources.
Resources
Once your application is functioning, your next step should be to optimize the network and bandwidth performance. You should aim to make the transfer of your application from server to client as fast and as efficient as possible. Your users will thank you for the fast page loads, you’ll save money on bandwidth and server resources, and you’ll also score better in Google’s search result ranks (which now take site speed into account).
The Resources tab in Developer Tools is your window into the communication between web server and client browser. You are able to see all of the resources requested by the browser (this is always very surprising!), the time it takes to receive them from the server, and how much bandwidth is used during the transfer.
Ironically, running the Resources tab affects page load performance, so it is disabled by default. The first time you access the functionality, you will need to enable it for the page you are viewing.
Enabling resources tracking ![]()
I recommend you leave the default Only enable for this session option selected, as you do not want to needlessly incur the small performance penalty. Once you click Enable resource tracking, the page will reload, and the Developer Tools will monitor and display the resources sent from the server.
The following screen shot shows the resources required, and loaded for, the Google homepage.
Google.com’s resource tracking ![]()
There’s a lot of information on this screen, so let’s take it piece by piece.
The default behavior is to show you how long it took to request and load all the resources for the page. Scrolling down the Resources list may surprise you, as you may not know how many individual requests are being made by the client. A high number of requests from the client can severely impact performance. Gaining visibility as to exactly what is requested is the first step to optimization and eventual reduction of resources.
If you are interested in just images or style sheets, you can filter the resource type using the menu directly under the main tab window.
Viewing only image resources 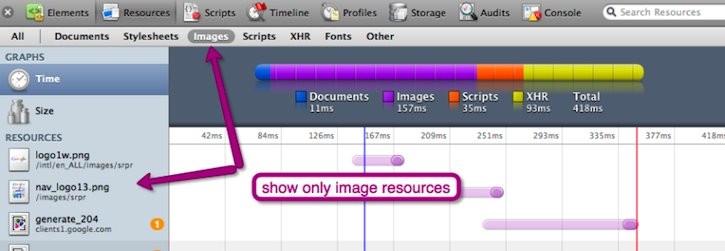
You’ll also learn the order in which the resources are requested. Using the timeline display, you may gain a better understanding of why certain elements on your page show up later than others.
After you gain an overview of all the requested resources and how they compose the entire request timeline, you’ll want to drill down to individual resources.
If you notice that some resources are being requested every time you access the page, that is a sign that your caching headers are not configured correctly. You can view all of the headers for a resource by clicking on the resource in the left hand list.
Viewing request headers 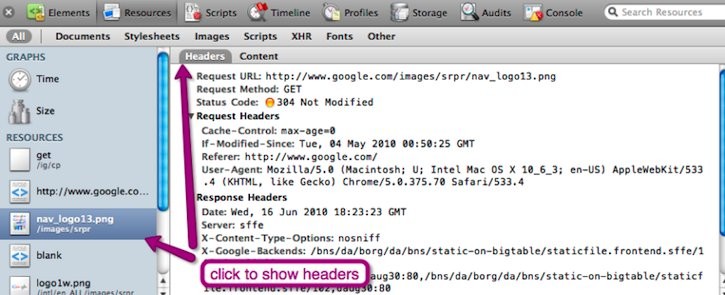
Use the Headers display to ensure that the expected HTTP Response Code is set and the appropriate headers are provided. For example, if the resource is rarely or never changed, your server should set an Expires header for far into the future. This will tell the browser that the resource shouldn’t be requested again until that date. This reduces the number of HTTP connections required for your page, thus speeding up your site.
Summary
There is a lot more to the Resources tab, which we will cover in a future article.
Use the Resources tab to gain visibility into how your client browser is communicating with the web server. Using this information, including request time, request size, and request order, you can make smart optimizations to reduce server load, costs, and increase speed and enhance user experience.
Speed is very important for your web site, your users, and search engines. Once you have the number and size of the page resources reduced, and the appropriate HTTP conversations occurring, the next step is to investigate and optimize the scripts that are running in your page. Luckily the Scripts tab, discussed next, does just that.
Continued in Part 2…
The Chrome Developer Tools is a rich array of tools to help web developers investigate, debug, and optimize their web applications. There’s much more functionality than we have covered in this article. Stay tuned for Part 2, where we will cover the Scripts, Timeline, Profiles, Storage, Audits, and the Console. Feedback is always welcome, so let us know what topics you’d like more information on.
Additional Resources
For more information on the Developer Tools, we recommend the following:
- Chrome Developer Tools presentation video and slides from Google I/O 2010
- Chrome Developer Tools Tutorial
And of course, stay tuned for Part 2 of this article, along with lots of other great HTML5 and Chrome content.
Attributions
Portions of this content come from HTML5Rocks! article