SVG basic shapes and text
By Mike Sierra
Summary
This guide introduces SVG’s basic graphic elements, from simple lines and shapes to complex polygons and freehand paths. It also shows how to place lines of text and wrap it around curved paths.
Simple shapes
Various SVG elements produce basic shapes, and their attributes specify their dimensions.
Rectangles are defined by their width and height attributes, while x and y offsets position the upper-left corner of the rect relative to its parent:
<rect x="10" y="10" width="240" height="160"/>
Circles are positioned by the cx and cy center point, and the radius (r) specifies the size:
<circle cx="50" cy="50" r="100"/>
Ellipses are positioned like circles, but require two rx and ry radius attributes for each axis:
<ellipse cx="40" cy="60" rx="40" ry="20"/>
When applied to rect elements, rx and ry attributes produce rounded corners:
<rect x="10" y="10" width="160" height="240" rx="20" ry="20"/>
This is how these examples appear:

Fill and stroke properties
By default, shapes are filled black. The fill and stroke properties specify the color of the background and the edge of the shape.
<rect fill="pink" stroke="red" x="10" y="10" width="160" height="240"/>
You can assign these as attributes on SVG elements, but they are really CSS properties. For the sake of clarity and best practice, this guide expresses SVG properties as CSS selectors:
 rect {
     fill   : pink;
     stroke : red;
 }
Properties specified via CSS override those specified as attributes, so this local CSS that colors the rect green overrides the local attribute that colors it red:
<rect fill="pink" stroke="red" style="fill:lightgreen;stroke:green"
    x="10" y="10" width="160" height="240"/>
The stroke-width is centered over the edge of the shape, so increasing its pixel value bleeds the stroke color both inside and outside the shape:
 rect {
     fill         : pink;
     stroke       : red;
     stroke-width : 6;
 }
To apply transparencies, you can set the fill-opacity and stroke-opacity properties.
 rect {
     stroke-width   : 10;
     stroke         : red;
     stroke-opacity : 0.5;
     fill           : red;
     fill-opacity   : 0.25;
 }

Alternately, you can use rgba() and hsla() CSS colors to to incorpoarate opacity as part of fill and stroke property values. The following has the same effect as the example above:
 rect {
     stroke-width : 10;
     stroke       : rgba(100%,0%,0%,0.5);
     fill         : rgba(100%,0%,0%,0.25);
 }
Lines and polygons
To draw a straight line, specify its start and end coordinates as x1, y1, x2, and y2:
<line x1="0" y1="0" x2="100" y2="100"/>
A polyline consists of a series of x/y coordinates specified within the points attribute, with items separated by either commas or whitespace. This draws an arrow:
<polyline points="100,225 100,115 130,115 70,15 70,15 10,115 40,115 40,225"/>
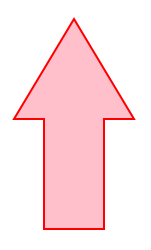
A polygon is the same as a polyline, but the final coordinate is joined with the first:
<polygon points="100,225 100,115 130,115 70,15 70,15 10,115 40,115 40,225"/>
More stroke properties
Additional properties provide greater control over how the ends or joints of line segments appear. The stroke-linecap property determines the appearance of the end of a stroke, or dashes within a stroke. Options appear as follows, with both round and square extending past the end of the line depending on the stroke-width::

stroke-linecap: round;

stroke-linecap: square;

stroke-linecap: butt;
The stroke-linejoin property affects how joined segments appear, and becomes more apparent for narrower angles as the stroke-width increases:
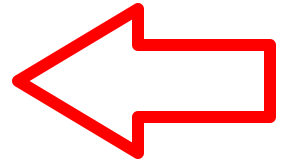
stroke-linejoin: round;
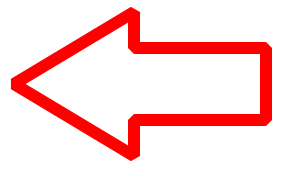
stroke-linejoin: bevel;
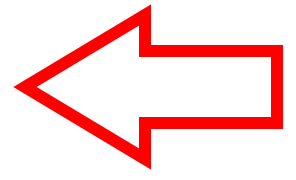
stroke-linejoin: miter;
Setting stroke-linejoin to bevel diagonally shaves the points from angles, and setting it to miter allows them to protrude. The stroke-miterlimit property limits how much of the angle is allowed to protrude, expressed relative to the stroke-width. This example only bevels those angles that protrude twice the width:
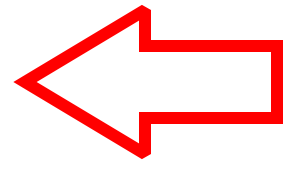
polygon {
  stroke-linejoin   : miter;
  stroke-miterlimit : 2;
  stroke-width      : 10;
}
The stroke-dasharray property allows you define arbitrary dash patterns as a comma-separated list of pixel values. A value of 20,10,10,10 draws a dash 20 pixels long, followed by a gap of 10 pixels before the following 10-pixel dash, another gap, followed the same pattern repeated to the end of the shape:

stroke-dasharray: 20,10,10,10;
The stroke-dashoffset property allows you to shift the number of pixels at which the dash pattern begins.
Simple paths
Paths are complex shapes that may feature discontinuous series of lines and curves. The path element’s d (definition) attribute specifies a sequence of commands referencing pairs of x/y coordinates within the drawing area.
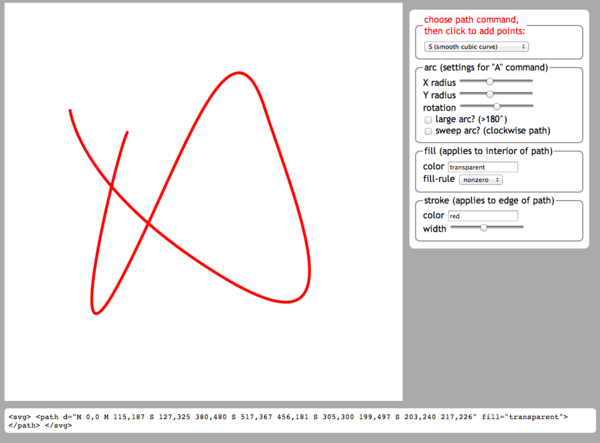
The following interactive path-building utility allows you to create your own path definitions using all the commands detailed below, and see them reflected in SVG code. Choose the command you want, then click within the drawing area to provide each command with a set of coordinates:
The simplest path commands drop a pen at one coordinate and draw a line to another. In this example, the M (move) command places the drawing point at the 100,225 coordinate. The L (line) command draws a line to 100,115, and subsequent L commands draw the same arrow-shaped polygon shown above, starting from its bottom-left corner and drawing in a clockwise direction:
<path d="M 100,225 L 100,115 L 130,115 L 70,15 L 10,115 L 40,115 L 40,225 z"/>

The z command at the end draws a final line to the most recent M coordinate to close off the box. At any point along the path, you may use M to place the drawing point elsewhere to create discontinuous segments known as subpaths, which may appear to be separate objects.
Coordinates and commands can be separated by any combination of commas or whitespace characters. (To clarify these examples, commas separate each x,y pair.)
The uppercase M and L commands above specify absolute coordinates. For all uppercase commands described here, there are alternative lowercase commands that specify coordinates in terms relative to the previously defined coordinate. Starting from the default 0,0 origin point, the following path defines the same shape as the one above using m and l commands:
<path d="m 100,225 l 0,-110 l 30,0 l -60,-100 l -60,100 l 30,0 l 0,110 z" />
The H and V commands, and their h and v alternatives, draw a horizontal or vertical line to the specified coordinate.
Curved paths
Unlike polygons, paths can incorporate curves. Bézier curves require additional control point coordinates that do not render but that influence the shape of the curve.
The Q and q commands define a quadratic Bézier curve using one control point coordinate followed by another coordinate where the curve segment ends. The C and c commands use two intervening control points to define a more complex cubic Bézier curve. These examples show where each control point falls:
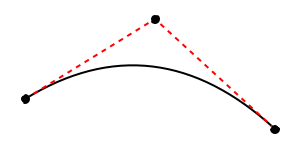
  <!-- quadratic -->
<path d="M 50,100 Q 180,20 300,130"/>
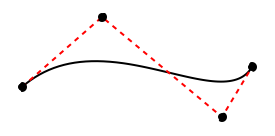
  <!-- cubic -->
<path d="M 50,120 C 130,50 250,150 280,100"/>
Adding additional sets of controls points has the same effect as adding additional Q/q/C/c commands. The following definition pairs produce the same sequence of quadratic and cubic curves, but the second line leaves out the redundant command:
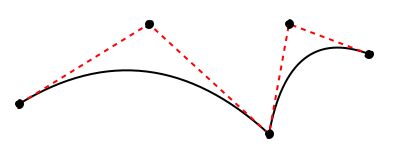
  <!-- quadratic, chained -->
<path d="M 50,100 Q 180,20 300,130 Q 320,20 400,50"/>
<path d="M 50,100 Q 180,20 300,130   320,20 400,50"/>
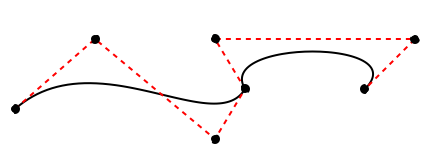
  <!-- cubic, chained -->
<path d="M 50,120 C 130,50 250,150 280,100 C 250,50 450,50 400,100"/>
<path d="M 50,120 C 130,50 250,150 280,100   250,50 450,50 400,100"/>
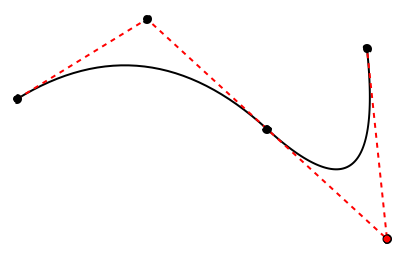
In both of these examples, the curve segments join abruptly at an angle. The T and t commands are designed to produce quadratic curves that transition smoothly from the previous curve. They work by extrapolating a control point from the previous control point on the other side of the previous destination point, effectively mirroring it to produce waves. The following two path definitions produce the same sequence of curves. The first uses the T command to extrapolate the extra control point (marked red), while the second uses a second Q command to explicitly define it. Both specify the same destination point:
<path d="M 50,100 Q 180,20 300,130 T         400,50"/>
<path d="M 50,100 Q 180,20 300,130 Q 420,240 400,50"/>
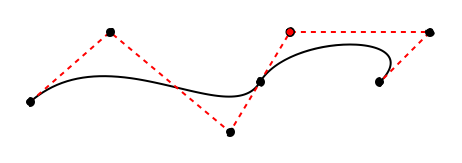
The S and s commands perform the same kind of mirroring to produce smooth cubic Bézier curves suitable for freehand drawing. Since Bézier curves are defined by two control points, the first supplied coordinate specifies the second control point, and the second coordinate specifies the end point. The following two path definitions produce the same sequence of curves, the second substituting the C command to explicitly define the extra control point, again marked red:
<path d="M 50,120 C 130,50 250,150 280,100 S        450,50 400,100"/>
<path d="M 50,120 C 130,50 250,150 280,100 C 310,50 450,50 400,100"/>
The A and a commands specify an elliptical arc, using syntax specifying a surprisingly great deal of information:
A pair of radius measurements defining the ellipse’s size and shape, equivalent to the ellipse element’s rx and ry attributes.
A measurement indicating the degree to which the ellipse is rotated.
A large-arc flag (0 or 1) indicating whether to travel to the destination point via the longer arc that exceeds 180°.
To distinguish between the two possible arcs that mirror each other along the line to the destination point, a sweep-arc flag (0 or 1) specifies whether to prefer whichever renders in a clockwise direction.
A final set of coordinates indicates the ellipse’s end point.
If the ellipse’s radii is insufficient or if its rotation makes it impossible to get to the final end point, the ellipse does not render.
Elliptical arcs are great for drawing parts of clouds and thought balloons:
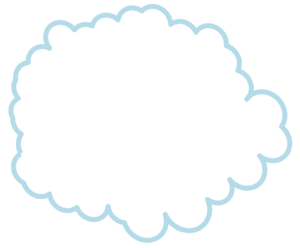
Experiment with the interactive path builder by choosing the A command and clicking to create new end points. The values of the arc radius, rotation, large-arc, and sweep-arc controls affect the appearance of the last elliptical arc in the path, and apply to newly created arcs.
This summarizes path syntax, with coordinate pairs required for control and destination points:
- M/m destination: jumps to destination point
- L/l destination: draws straight line to destination point
- Q/q control destination: draws quadratic Bézier curve to destination point, shaped by control point
- T/t destination: draws quadratic curve to destination point, influenced by virtual control point mirroring most recent control point
- C/c control1 control2 destination: draws a cubic Bézier curve to destination point, shaped by two control points
- S/s control2 destination: draws a cubic Bézier curve to destination point, shaped by a virtual control point mirroring the most recent control point, and by a second explicit control2 point
- A/a radiusX,radiusY rotationAngle large-arc-flag sweep-arc-flag destination: draws an elliptical arc to destination, if possible, with overall ellipse shaped by radiusX,radiusY and rotated by rotationAngle. The large-arc-flag prefers the widest-angle arc path, and sweep-arc-flag specifies the ellipse whose arc path travels clockwise to get to the destination point.
Fill rules
Whenever lines within paths cross each other, and when subpath shapes appear as islands within other shapes, it is not immediately obvious how such paths might be filled. By default, the fill-rule property is set to nonzero, which errs on the side of filling regions based on the direction of each stroke, which as the example below shows, may not always be intuitive. Setting it to evenodd prevents regions bordering each other from sharing the same fill value.
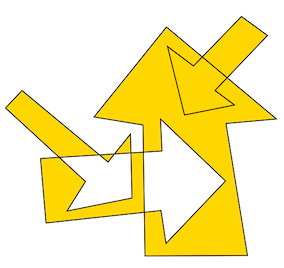
fill-rule: nonzero;
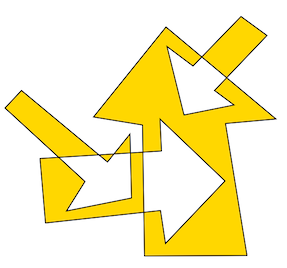
fill-rule: evenodd;
Note that while these arrows appear to be separate graphics, they are actually sub-paths. The fill-rule property only applies in this case.
Markers
You can attach arrowheads or other graphic objects to paths, lines, polylines, and polygon segments. A marker element encapsulates a graphic, and various properties reference it. Here is a typical arrowhead, for convenience placed within a defs region as a common definition:
<defs>
  <marker id="arrowhead" markerWidth="10" markerHeight="10" orient="auto" refX="2" refY="5">
    <polygon points="0,0 10,5 0,10"/>    <!-- triangle pointing right -->
  </marker>
</defs>
The marker element does not render unless it is associated with a path or other line element using various marker-related properties. This example places the arrowhead at the end of the last path segment:
 path.pointer {
     marker-end: url(#arrowhead);
 }
Alternately, the marker-start property places the marker at the path’s starting point. Setting marker-mid places the marker at each segment point within the path, including where subpaths terminate. The marker property places the graphic at all these points:
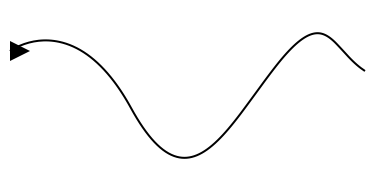
marker-start
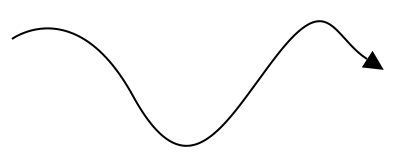
marker-end
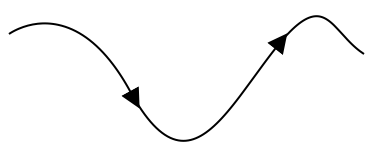
marker-mid
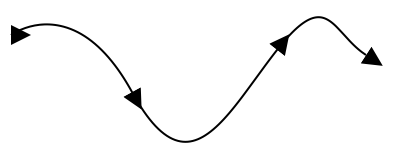
marker
Several marker element attributes are necessary to place the arrowhead correctly over the path. By default, the top left corner of the marker graphic is placed over the path or line. Since the graphic is a 10-pixel square in this case, the refY attribute moves the point at which it intersects the line down by 5 pixels, in order to center it vertically.
The marker graphic also does not rotate by default to match where the path or line is pointing. Setting orient to auto aligns the graphic’s horizontal x axis. You can also set orient to specific degree values. Note in the marker-start example above that the initial marker may not be oriented as intended, because it’s not associated with an existing line.
Text
Text behaves much like any other SVG graphic. You can mix text with other graphics, but you can’t automatically break lines into blocks of text as in HTML, so you have to set each line independently. Use each text element’s x and y attributes to position its baseline:
<text x="100" y="50">The quick brown fox</text>
<text x="100" y="80">jumped over the lazy dog.</text>

You can apply standard CSS font properties, along with the text-anchor property to center the text from the specified coordinates. You can also control apply fill and stroke properties just like any other shape:
text {
    font-family  : Tahoma, sans-serif;
    font-size    : smaller;
    font-weight  : bold;
    text-anchor  : middle;
    fill         : red;
    stroke       : #777;
    stroke-width : 0.5;
}

Use the tspan element to mark and style inline font changes:
<text x="100" y="50">The quick brown fox</text>
<text x="100" y="80">
  jumped
     <tspan class="emphasis">over</tspan>
  the lazy dog.
</text>
.emphasis {
    font-style      : italic;
    text-decoration : underline;
}

This example uses the dy attribute to move text upward to a superscript position and then back down to its original baseline, and rotate to spin each character of text. (Applying dx likewise would displace text horizontally.)
<text x="100" y="50">The quick brown fox</text>
<text x="100" y="80">
  jumped
  <tspan rotate="-20" dy="-5">over</tspan>
  <tspan dy="5">the lazy dog.</tspan>
</text>

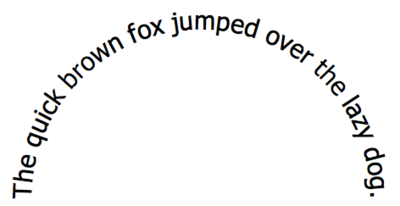
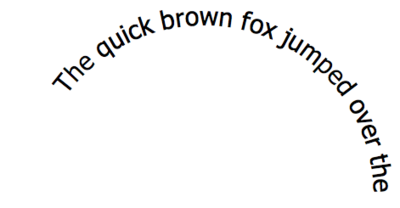
SVG also allows you to place text along the curve of a path. The textPath element diverts any nested text to render along the path it references:
<defs>
<path id="curve" d="M 100,300 A 1,1 0 0 1 500,300" />
<text id="textContent">The quick brown fox jumped over the lazy dog.</text>
</defs>
<text>
  <textPath xlink:href="#curve" startOffset="20%">
    <tref xlink:href="#textContent" />
  </textPath>
</text>
The tref element allows you to separately pull in text from a referenced text element.
The textPath's startOffset pushes text from the start of the path, disappearing as the path ends. Below the text appears before and after applying the offset:
See SVG Fonts for information on SVG’s support for creating font glyphs.